By now, many farmers will have taken their soil samples for the season ahead and received their results.
At first glance, soil sample results can be daunting, but it is essential to examine the results carefully and ensure that you are getting the most from your soil.
Only 20% of Irish soils are at optimum fertility levels, so chances are on receipt of your soil test results, changes and improvements will need to be made to your nutrient management plan, whether that be building phosphorus (P) and/or potassium (K) levels, or fixing soil pH. More detailed samples can also give an insight into important nutrients like magnesium and copper.
Some farmers may choose to discuss the results with their advisor or agricultural consultant and allow them to work on a nutrient management plan. This can often lessen the load, as taking all factors into account, such as animal feed use, allowances for yield and derogation, can become complicated and under cross compliance, a nutrient management plan must be provided and be within the regulations.
Many will go about the job themselves, but the important thing is that you have an up-to-date nutrient management plan to work with.
Soil pH
The first thing that you should look at on the results page is the soil pH. Soil pH is one of the biggest factors affecting nutrient availability and the requirement varies with different crops.
Optimum soil pH levels
Grassland – 6.3.Grassland with high molybdenum – 6.2.Cereals and maize – 6.5.Beet, beans, peas and oilseeds – 7.0.Potatoes – 6.0.Lime should not be applied in quantities larger than 3t/ac. Once applied, it will take time to make an impact, so testing in two years’ time and amending again may be necessary.
Building and maintaining soil fertility
Soil fertility can be built and maintained using both organic and artificial sources. Organic manures can help to build up organic matter, which will improve soil structure and increase nutrient storage potential.
When looking at the soil test results, a reading in mg/l will show each of the nutrients. This figure allows for categorization into the appropriate soil index. A soil index of 1 means that the nutrient is extremely low in the soil. Index 2 refers to soils where nutrients are low. At index 1 and 2, enough nutrients need to be applied to provide the crop with its nutrient requirement, but also to build soil fertility.
Index 3 is the optimum soil index and enough nutrient needs to be applied to feed the plant and maintain the soil at this level. Index 4 means that the nutrient levels are high in the soil and according to your results do not require fertiliser, but caution is needed here. For example, soils with a pH greater than or equal to 7 can receive 20kg P/ha at index 4.
At index 4, you might try to bring the soil index back down to index 3, but caution is needed here – and more regular testing – as you do not want to end up in a situation where a nutrient is neglected and the soil index drops to index 2.
Applying nutrients according to yield is another key part of deciding on the nutrient allowance.
Nitrogen
In the case of nitrogen (N), yield potential will dictate the recommendation, as we cannot currently test for nitrogen in the soil with any degree of confidence. N is extremely mobile in the soil, so while we could test for soil mineral nitrogen content, that figure could change an hour, a day or a week after sampling with a shower of rain or a change in temperature.
Useful app
The Fertilizer Association of Ireland has a handy app available on your smartphone or PC, which will help calculate fertiliser requirements. The screenshots provided show an example of the information inputted into the app and the fertiliser advice given.
Figure 1 shows a spring barley crop, expected to reach 8t/ha grain yield (proof of past yields needed), which is in index 2 for P and index 1 for K, and is receiving 20t/ha of farmyard manure. It requires 16kg/ha of P and 1kg/ha of K – 24kg/ha of P and 120kg/ha of K are estimated to be supplied from the farmyard manure.
Figure 2 shows requirements for grazing (dairy) at a stocking rate of <240kg/ha organic N and concentrate feed usage of 0.5t/ha, with cattle slurry applied at 1,000 gallons/ac (11t/ha) at a soil P index of 2 and a K index of 1.
Figure 3 shows results for an 11t/ha winter wheat crop at a P index of 3 and a K index of 2, with no organic manure applied. It is important to include the field use (grassland or tillage) with your soil sample information, as P levels (mg/l) for the different soil indexes vary for grassland and tillage soils. For example, soils with 3.1-5mg/l P fall into index 2 on grassland soils, but soils with a P level of 3.1-6 fall into index 2 on tillage soils.
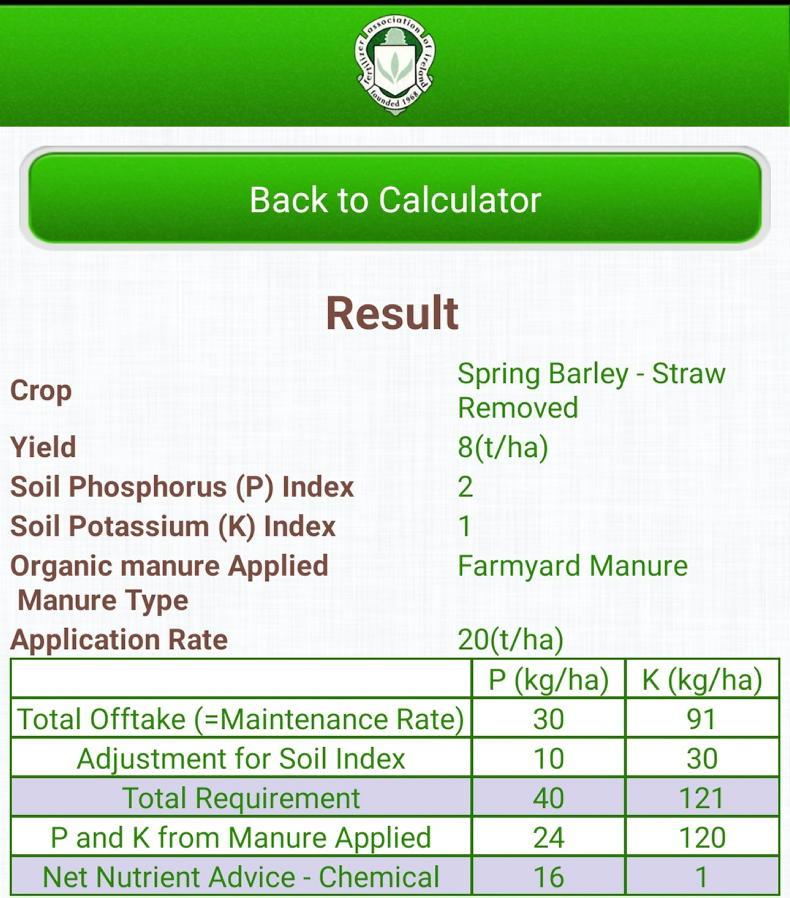
Figure 1. Example of fertiliser advice on spring barley
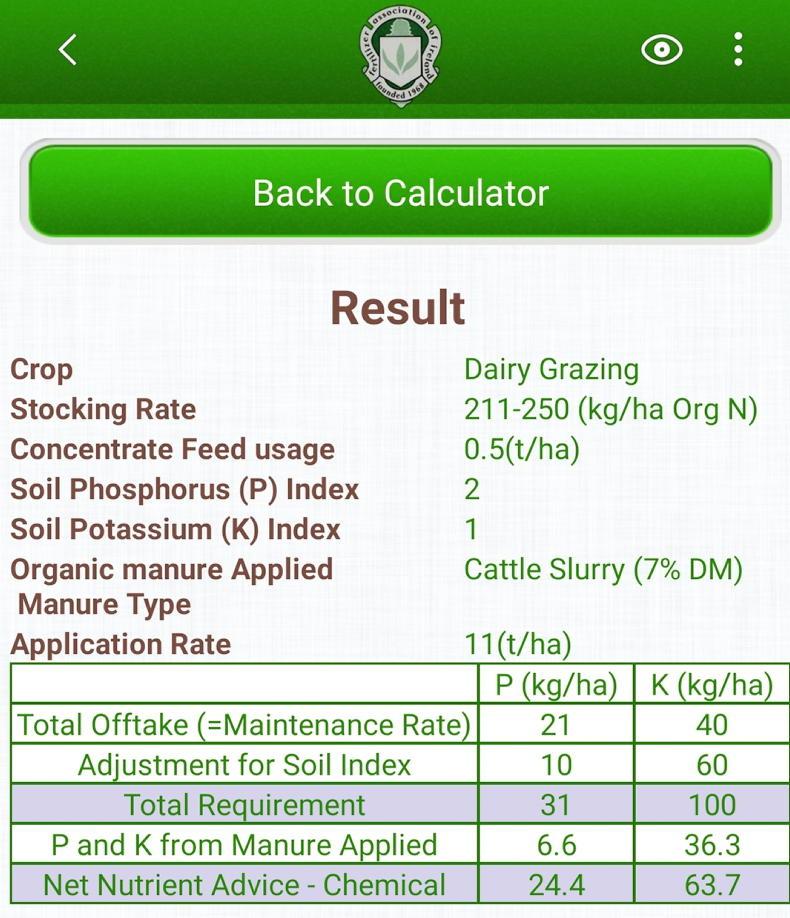
Figure 2. Example of fertiliser advice on dairy grazing

Figure 3. Example of fertiliser advice on winter wheat

By now, many farmers will have taken their soil samples for the season ahead and received their results.
At first glance, soil sample results can be daunting, but it is essential to examine the results carefully and ensure that you are getting the most from your soil.
Only 20% of Irish soils are at optimum fertility levels, so chances are on receipt of your soil test results, changes and improvements will need to be made to your nutrient management plan, whether that be building phosphorus (P) and/or potassium (K) levels, or fixing soil pH. More detailed samples can also give an insight into important nutrients like magnesium and copper.
Some farmers may choose to discuss the results with their advisor or agricultural consultant and allow them to work on a nutrient management plan. This can often lessen the load, as taking all factors into account, such as animal feed use, allowances for yield and derogation, can become complicated and under cross compliance, a nutrient management plan must be provided and be within the regulations.
Many will go about the job themselves, but the important thing is that you have an up-to-date nutrient management plan to work with.
Soil pH
The first thing that you should look at on the results page is the soil pH. Soil pH is one of the biggest factors affecting nutrient availability and the requirement varies with different crops.
Optimum soil pH levels
Grassland – 6.3.Grassland with high molybdenum – 6.2.Cereals and maize – 6.5.Beet, beans, peas and oilseeds – 7.0.Potatoes – 6.0.Lime should not be applied in quantities larger than 3t/ac. Once applied, it will take time to make an impact, so testing in two years’ time and amending again may be necessary.
Building and maintaining soil fertility
Soil fertility can be built and maintained using both organic and artificial sources. Organic manures can help to build up organic matter, which will improve soil structure and increase nutrient storage potential.
When looking at the soil test results, a reading in mg/l will show each of the nutrients. This figure allows for categorization into the appropriate soil index. A soil index of 1 means that the nutrient is extremely low in the soil. Index 2 refers to soils where nutrients are low. At index 1 and 2, enough nutrients need to be applied to provide the crop with its nutrient requirement, but also to build soil fertility.
Index 3 is the optimum soil index and enough nutrient needs to be applied to feed the plant and maintain the soil at this level. Index 4 means that the nutrient levels are high in the soil and according to your results do not require fertiliser, but caution is needed here. For example, soils with a pH greater than or equal to 7 can receive 20kg P/ha at index 4.
At index 4, you might try to bring the soil index back down to index 3, but caution is needed here – and more regular testing – as you do not want to end up in a situation where a nutrient is neglected and the soil index drops to index 2.
Applying nutrients according to yield is another key part of deciding on the nutrient allowance.
Nitrogen
In the case of nitrogen (N), yield potential will dictate the recommendation, as we cannot currently test for nitrogen in the soil with any degree of confidence. N is extremely mobile in the soil, so while we could test for soil mineral nitrogen content, that figure could change an hour, a day or a week after sampling with a shower of rain or a change in temperature.
Useful app
The Fertilizer Association of Ireland has a handy app available on your smartphone or PC, which will help calculate fertiliser requirements. The screenshots provided show an example of the information inputted into the app and the fertiliser advice given.
Figure 1 shows a spring barley crop, expected to reach 8t/ha grain yield (proof of past yields needed), which is in index 2 for P and index 1 for K, and is receiving 20t/ha of farmyard manure. It requires 16kg/ha of P and 1kg/ha of K – 24kg/ha of P and 120kg/ha of K are estimated to be supplied from the farmyard manure.
Figure 2 shows requirements for grazing (dairy) at a stocking rate of <240kg/ha organic N and concentrate feed usage of 0.5t/ha, with cattle slurry applied at 1,000 gallons/ac (11t/ha) at a soil P index of 2 and a K index of 1.
Figure 3 shows results for an 11t/ha winter wheat crop at a P index of 3 and a K index of 2, with no organic manure applied. It is important to include the field use (grassland or tillage) with your soil sample information, as P levels (mg/l) for the different soil indexes vary for grassland and tillage soils. For example, soils with 3.1-5mg/l P fall into index 2 on grassland soils, but soils with a P level of 3.1-6 fall into index 2 on tillage soils.
Figure 1. Example of fertiliser advice on spring barley
Figure 2. Example of fertiliser advice on dairy grazing
Figure 3. Example of fertiliser advice on winter wheat


 This is a subscriber-only article


SHARING OPTIONS: