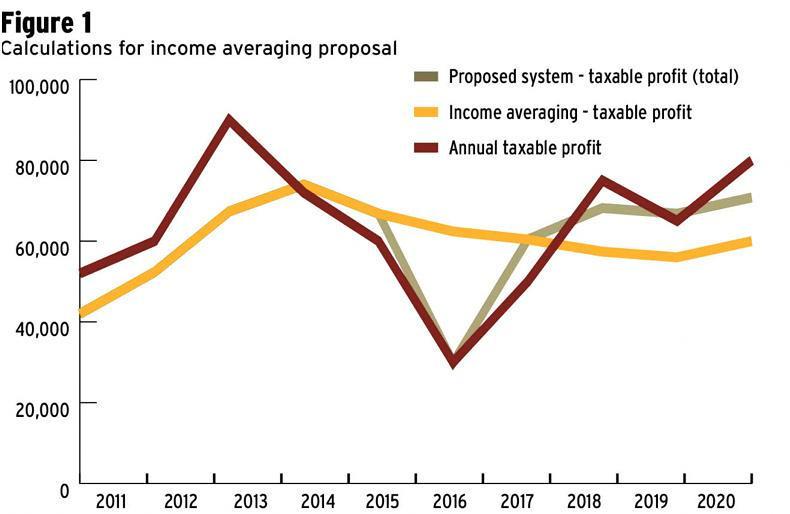
The figure above shows how the new income averaging rules will work.
The example is for a dairy farmer with about 100 cows and no debt or capital investments needed.
The red line shows taxable profit each year. Profit falls in 2016 to €30,000, about half the average of other years.
The yellow line shows taxable profit if the farmer is using the current income averaging rules.
The rules put his 2016 taxable
income at €62,400, which would
result in a high tax bill in a difficult year.
The grey line shows taxable profit each year using the opt-out allowed for this year under the new rules introduced in Budget 2017. Taxable profit in 2016 is €30,000. That reduces the tax bill to be paid for this year.
We can see that the deferred taxable income is added in three equal shares to taxable income made in 2018, 2019 and 2020. Higher tax would arise in those years.
The total amount of tax paid over the five years remains the same – one of the basic points of income averaging.
In summary:
In the above graph, the red line shows actual taxable income arising each year before use of income averaging. Note the drop in income in 2016. The yellow line shows taxable income under the current averaging rules – note how taxable income is deemed not to have fallen significantly in 2016. Instead, taxable income falls in the following years (2016-2020), as the effect of 2016 feeds through. Finally, the grey line shows how the new opt-out rule allows a farmer to declare a lower taxable income in 2016. We see how the deferred taxable income appears in the years 2017 to 2020, with higher tax bills than arising in those years. Read more
Full coverage: Budget 2017


 This is a subscriber-only article


SHARING OPTIONS: