A key recommendation from the Joint Oireachtas Committee on Agriculture’s recently published report into the Future of the Tillage Sector in Ireland was to analyse the potential of agricultural crop insurance schemes such as those operated in other countries.
For many US farmers, crop insurance has become their primary tool in dealing with production and price risk. Crop insurance in the US was originally designed as a speedy mechanism to deliver compensation to farmers in the event of an agricultural disaster (hail, floods, drought etc).
However, since the introduction of the 1938 Federal Crop Insurance Act, crop insurance has grown into a highly complex programme, offering multiple risk-management options to US producers.
In 2016, over 80% of US farmers bought crop insurance, protecting nearly $101bn worth of crops and $533m of livestock, which is now available for nearly 550 unique crops and types.
Private crop
insurance
Private crop insurance policies have been available for decades and are not part of the Federal Crop Insurance Program. These policies are provided directly to farmers by private insurers and can be bought at any stage throughout the season on a single-peril acre-by-acre basis.
The most common type of private policy is crop hail insurance, covering physical damage caused by hailstone storms, which account for about 6% of all crop losses in any given year.
Federal crop
insurance
Multi-Peril Crop Insurance (MPCI) is the general name given to crop policies provided through the Federal Crop Insurance Corporation (FCIC). Federal MPCI programs are administered by the Risk Management Agency (RMA), which underwrites crop insurance policies for hundreds of crop types and livestock systems in the US. These policies provide coverage to the producer for losses in yield and revenue from weather and market volatility.
How it works
The Federal Crop Insurance Program operates through a unique public-private partnership between the US government and private insurance companies. The United States Department of Agriculture (USDA) works with 12 approved insurance providers (AIPs) to deliver a subsidised crop insurance programme.
The government subsidises a large proportion of the premium (up to 62%) while the producers pay the rest. This means that the AIPs only retain a small part of the risk.
Depending on the policy, producers choose their level of coverage based on their actual production history (APH), commodity price or revenue. This generally ranges from 50% to 100%. The higher the coverage level, the lower the government subsidy rate.
As you can tell, maintaining accurate production history records is essential for crop insurance to be effective for both individual and area level policies.
Value for money
The value of the taxpayer’s dollar is often called into question for this programme and varies from year to year. Over the past number of years, total yearly premiums have averaged $9bn to $10bn. Nearly $6bn of this was subsidised by the government.
Advocates of the programme argue that the overall value of the crops which are protected (over $100bn) far outweighs the actual cost of the programme.
As well as this, the loss ratio, which is the payments made on crop insurance policies divided by a total premium paid for crop insurance policies, have averaged 0.81 for all crop insurance policies during the last 10 years. A loss ratio below 1.00 indicates that payments are less than premium.
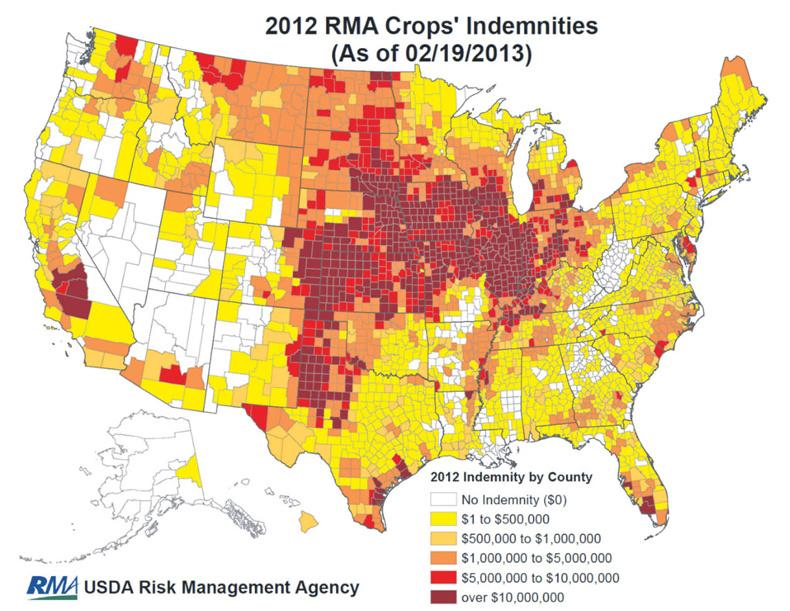
One of the highest loss ratios occurred in 2012 when widespread drought conditions across the United States caused 83% of losses that year, totalling nearly $17.5bn in loss payments. This resulted in a loss ratio of 1.59 (see Table 1).
Critics of the programme argue that farmers are receiving double subsidies through other state-wide USDA farm programmes, such as Agriculture Risk Coverage (ARC) and Price Loss Coverage (PLC), as well as a subsidised crop insurance program. The overall cost of crop insurance is continuously called into question. Many Capitol Hill policy makers have reducing subsidy rates for crop insurance programs in their sights for reform.
Individual plans
There are multiple plans available which differ between certain states or even counties. Individual plans are based upon the insured’s production and revenue history.
Actual Production History (APH): The APH insurance plan provides protection against a loss in yield due to nearly all-natural disasters including drought, flood, frost, wind, insects and disease. This insurance plan guarantees a yield level based on the individual producer’s actual production history. The RMA will establish the price of the crop. An indemnity may be due if the production (harvested and appraised) is less than the guaranteed amount. Yield Protection (YP): YP also provides protection against a loss in yield due to unavoidable naturally occurring events. Unlike the APH plan, a price for YP is established according to the crop’s commodity board of trade/exchange as defined in the Commodity Exchange Price Provisions (CEPP). This price is used to determine the yield protection guarantee premium and to value the production to count. An indemnity is due when the value of the relevant production is less than the yield protection guarantee. Revenue Protection (RP): RP provides protection against a loss of revenue caused by price increase or decrease, low yields or a combination of both. This coverage guarantees an amount based on the individual producer’s production history and either the greater of the crop’s projected price or actual harvest price. Both the projected price and actual harvest price are established according to the crop’s commodity board of trade/exchange as defined in the CEPP. An indemnity is due when the calculated revenue (production to count times harvest price) is less than the revenue protection guarantee for the crop acreage. Revenue Protection with Harvest Price Exclusion (RP-HPE): RP-HPE is similar to RP, but coverage provides protection against loss of revenue caused by price decrease, low yields or a combination of both. Unlike RP, the revenue protection guarantee for RP-HPE is based on the projected price only and it does not increase based on the actual price at harvest. Area plans
Area plans insure against a county-wide loss of production on a crop. The theory behind this is that when an entire county’s crop yield is low, most producers in that county will also have low yields.
If the actual county yield or revenue falls below the expected county yield then a loss occurs and an indemnity is due. The level of coverage depends on county, as can be seen in Figure 1.
The different area plans are broadly similar to the individual plans, except that they are triggered across an area rather than a specified acreage.
Area Yield Protection (AYP): AYP pays the insured in the event of the final county yield falling below the insured’s trigger yield. The Federal Crop Insurance Corporation (FCIC) will issue the final county yield in the calendar year following the crop year insured. Area Revenue Protection (ARP): The ARP Plan provides coverage against loss of revenue due to a county level production loss, a price decline or a combination of both. ARP will pay a loss when the final county revenue is less than the trigger revenue, which is calculated using the higher of the projected price or harvest price.Area Revenue Protection with Harvest Price Exclusion (ARP-HPE): ARP-HPE policy provides protection against loss of revenue due to a county level production loss, price decline or a combination of both. Unlike ARP, this plan only uses the projected price and does not provide upside harvest price protection. An indemnity is due under ARP-HPE when the final county revenues, published by FCIC, are less than the trigger revenue. Example of how Revenue
Protection works
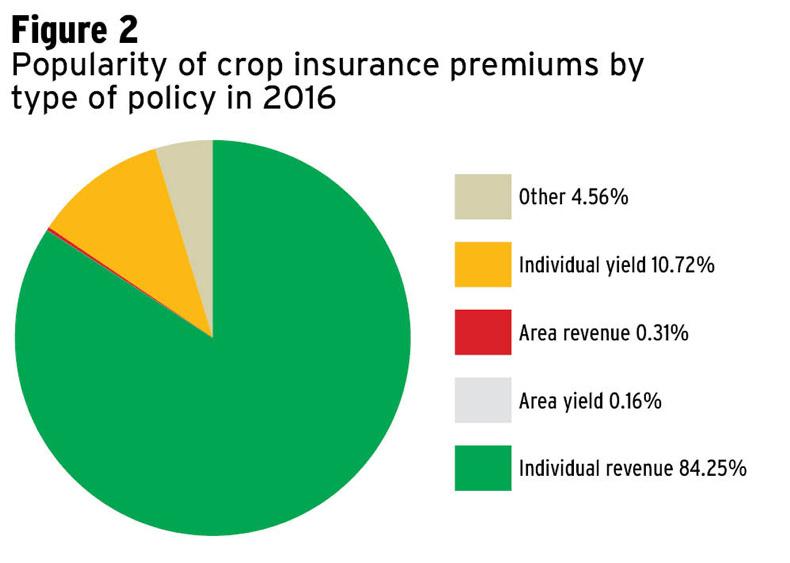
Revenue protection continues to be the most widely subscribed policy by US farmers, Steve Miller of Miller Insurance explained (see Figure 2). It provides coverage for both price and yield variations and, in Steve’s opinion, is the best policy for managing risk.
The pricing structure of each policy varies from state to state based upon the actuarial data. The most common coverage is between 75% and 85% and sold by enterprise units (EUs), ie farm-wide coverage.
For example, if we take a farmer in the Nodaway County in Missouri who farms 100 acres of owned non-irrigated corn. This farmer has a four-year yield average of 122 bushel/acre (3.1t/ac) and he decides to take out RP insurance in early spring.
The insurance provider uses the December futures price of $3.96/bu to insure against. If the farmer buys 85% coverage of the 122 bu/ac average yield, this gives a trigger yield of 103.7 bu/ac (2.6t/ac).
The design of RP means that the guarantee is not the 103.7 bu/ac yield or the $3.96/bu price, but it is in fact these two figures multiplied. So the farmer’s guarantee is to receive $410.65/ac.
Once the producer’s revenue drops below this figure, then they are entitled to make a claim. The maximum indemnity which they are entitled to is $41,065, costing the producer $21.76/ac. This cost per acre figure excludes the government subsidy of 55%.
Details of the mechanisms involved in these calculations are shown in Table 2.?
Insurance industry lingo
Premiums: The amount to be paid for an insurance policy.
Indemnities: The compensation for damages or loss.
Loss ratio: The difference between the ratios of premiums paid to an insurance company and the claims settled by the company.
Premium subsidies: The federal financial assistance which subsidises the cost of the premium.
Read more
10% of 2017 straw harvest lost
Tillage management: soil testing, EPA and diary dates
A key recommendation from the Joint Oireachtas Committee on Agriculture’s recently published report into the Future of the Tillage Sector in Ireland was to analyse the potential of agricultural crop insurance schemes such as those operated in other countries.
For many US farmers, crop insurance has become their primary tool in dealing with production and price risk. Crop insurance in the US was originally designed as a speedy mechanism to deliver compensation to farmers in the event of an agricultural disaster (hail, floods, drought etc).
However, since the introduction of the 1938 Federal Crop Insurance Act, crop insurance has grown into a highly complex programme, offering multiple risk-management options to US producers.
In 2016, over 80% of US farmers bought crop insurance, protecting nearly $101bn worth of crops and $533m of livestock, which is now available for nearly 550 unique crops and types.
Private crop
insurance
Private crop insurance policies have been available for decades and are not part of the Federal Crop Insurance Program. These policies are provided directly to farmers by private insurers and can be bought at any stage throughout the season on a single-peril acre-by-acre basis.
The most common type of private policy is crop hail insurance, covering physical damage caused by hailstone storms, which account for about 6% of all crop losses in any given year.
Federal crop
insurance
Multi-Peril Crop Insurance (MPCI) is the general name given to crop policies provided through the Federal Crop Insurance Corporation (FCIC). Federal MPCI programs are administered by the Risk Management Agency (RMA), which underwrites crop insurance policies for hundreds of crop types and livestock systems in the US. These policies provide coverage to the producer for losses in yield and revenue from weather and market volatility.
How it works
The Federal Crop Insurance Program operates through a unique public-private partnership between the US government and private insurance companies. The United States Department of Agriculture (USDA) works with 12 approved insurance providers (AIPs) to deliver a subsidised crop insurance programme.
The government subsidises a large proportion of the premium (up to 62%) while the producers pay the rest. This means that the AIPs only retain a small part of the risk.
Depending on the policy, producers choose their level of coverage based on their actual production history (APH), commodity price or revenue. This generally ranges from 50% to 100%. The higher the coverage level, the lower the government subsidy rate.
As you can tell, maintaining accurate production history records is essential for crop insurance to be effective for both individual and area level policies.
Value for money
The value of the taxpayer’s dollar is often called into question for this programme and varies from year to year. Over the past number of years, total yearly premiums have averaged $9bn to $10bn. Nearly $6bn of this was subsidised by the government.
Advocates of the programme argue that the overall value of the crops which are protected (over $100bn) far outweighs the actual cost of the programme.
As well as this, the loss ratio, which is the payments made on crop insurance policies divided by a total premium paid for crop insurance policies, have averaged 0.81 for all crop insurance policies during the last 10 years. A loss ratio below 1.00 indicates that payments are less than premium.
One of the highest loss ratios occurred in 2012 when widespread drought conditions across the United States caused 83% of losses that year, totalling nearly $17.5bn in loss payments. This resulted in a loss ratio of 1.59 (see Table 1).
Critics of the programme argue that farmers are receiving double subsidies through other state-wide USDA farm programmes, such as Agriculture Risk Coverage (ARC) and Price Loss Coverage (PLC), as well as a subsidised crop insurance program. The overall cost of crop insurance is continuously called into question. Many Capitol Hill policy makers have reducing subsidy rates for crop insurance programs in their sights for reform.
Individual plans
There are multiple plans available which differ between certain states or even counties. Individual plans are based upon the insured’s production and revenue history.
Actual Production History (APH): The APH insurance plan provides protection against a loss in yield due to nearly all-natural disasters including drought, flood, frost, wind, insects and disease. This insurance plan guarantees a yield level based on the individual producer’s actual production history. The RMA will establish the price of the crop. An indemnity may be due if the production (harvested and appraised) is less than the guaranteed amount. Yield Protection (YP): YP also provides protection against a loss in yield due to unavoidable naturally occurring events. Unlike the APH plan, a price for YP is established according to the crop’s commodity board of trade/exchange as defined in the Commodity Exchange Price Provisions (CEPP). This price is used to determine the yield protection guarantee premium and to value the production to count. An indemnity is due when the value of the relevant production is less than the yield protection guarantee. Revenue Protection (RP): RP provides protection against a loss of revenue caused by price increase or decrease, low yields or a combination of both. This coverage guarantees an amount based on the individual producer’s production history and either the greater of the crop’s projected price or actual harvest price. Both the projected price and actual harvest price are established according to the crop’s commodity board of trade/exchange as defined in the CEPP. An indemnity is due when the calculated revenue (production to count times harvest price) is less than the revenue protection guarantee for the crop acreage. Revenue Protection with Harvest Price Exclusion (RP-HPE): RP-HPE is similar to RP, but coverage provides protection against loss of revenue caused by price decrease, low yields or a combination of both. Unlike RP, the revenue protection guarantee for RP-HPE is based on the projected price only and it does not increase based on the actual price at harvest. Area plans
Area plans insure against a county-wide loss of production on a crop. The theory behind this is that when an entire county’s crop yield is low, most producers in that county will also have low yields.
If the actual county yield or revenue falls below the expected county yield then a loss occurs and an indemnity is due. The level of coverage depends on county, as can be seen in Figure 1.
The different area plans are broadly similar to the individual plans, except that they are triggered across an area rather than a specified acreage.
Area Yield Protection (AYP): AYP pays the insured in the event of the final county yield falling below the insured’s trigger yield. The Federal Crop Insurance Corporation (FCIC) will issue the final county yield in the calendar year following the crop year insured. Area Revenue Protection (ARP): The ARP Plan provides coverage against loss of revenue due to a county level production loss, a price decline or a combination of both. ARP will pay a loss when the final county revenue is less than the trigger revenue, which is calculated using the higher of the projected price or harvest price.Area Revenue Protection with Harvest Price Exclusion (ARP-HPE): ARP-HPE policy provides protection against loss of revenue due to a county level production loss, price decline or a combination of both. Unlike ARP, this plan only uses the projected price and does not provide upside harvest price protection. An indemnity is due under ARP-HPE when the final county revenues, published by FCIC, are less than the trigger revenue. Example of how Revenue
Protection works
Revenue protection continues to be the most widely subscribed policy by US farmers, Steve Miller of Miller Insurance explained (see Figure 2). It provides coverage for both price and yield variations and, in Steve’s opinion, is the best policy for managing risk.
The pricing structure of each policy varies from state to state based upon the actuarial data. The most common coverage is between 75% and 85% and sold by enterprise units (EUs), ie farm-wide coverage.
For example, if we take a farmer in the Nodaway County in Missouri who farms 100 acres of owned non-irrigated corn. This farmer has a four-year yield average of 122 bushel/acre (3.1t/ac) and he decides to take out RP insurance in early spring.
The insurance provider uses the December futures price of $3.96/bu to insure against. If the farmer buys 85% coverage of the 122 bu/ac average yield, this gives a trigger yield of 103.7 bu/ac (2.6t/ac).
The design of RP means that the guarantee is not the 103.7 bu/ac yield or the $3.96/bu price, but it is in fact these two figures multiplied. So the farmer’s guarantee is to receive $410.65/ac.
Once the producer’s revenue drops below this figure, then they are entitled to make a claim. The maximum indemnity which they are entitled to is $41,065, costing the producer $21.76/ac. This cost per acre figure excludes the government subsidy of 55%.
Details of the mechanisms involved in these calculations are shown in Table 2.?
Insurance industry lingo
Premiums: The amount to be paid for an insurance policy.
Indemnities: The compensation for damages or loss.
Loss ratio: The difference between the ratios of premiums paid to an insurance company and the claims settled by the company.
Premium subsidies: The federal financial assistance which subsidises the cost of the premium.
Read more
10% of 2017 straw harvest lost
Tillage management: soil testing, EPA and diary dates


SHARING OPTIONS