

Reduced costs were the main factor in this income rise, as both farm sales and subsidies fell by 3% each. Costs were down by 6%, with the excellent summer seeing reduced feed and fertiliser bills. These figures are, of course, improvements on 2013, which had a nightmare opening six months, culminating in the late spring fodder crisis that depressed incomes for that year.
Sectoral and regional disparities continue to be displayed by the figures. As usual, dairy and tillage farmers have the best average incomes, with drystock farmers lagging behind.
Drystock farms are typically smaller, while tillage and dairy dominate areas of the country with the best land. The border region of the northwest has the lowest average income, while the southeast has the highest.
Borrowings reflect the differing repayment capacity across sectors. Dairy farms have total borrowings of €63,000, with €22,000 of new investment in 2014 alone. This is almost equal to the €23,000 total farm borrowings on beef farms.
Falling costs, increased output and decent milk prices saw incomes rise.
Production rose 5% as farmers revved up with the impending abolition of quotas. This outweighed a 3% price fall when combined with lower production costs. Concentrate spend was down by 25% and forage costs fell by a fifth. These are record income figures for dairy farming. One in five farmers made over €100,000 last year – double the comparable figure only two years previously.
There is one cloud over these figures though – the superlevy bill incurred on the 2014-15 production year. The bill totals €60m, about €15m of which was withheld in 2014 milk cheques and is accounted for here. The remainder will be paid over 2015-2017 – a further €15m annually.
It was a year of swings and roundabouts on tillage farms.
Prices fell sharply but good yields tempered the fall in output to 8%. Costs fell 11%, with good growing and working conditions throughout the year minimising costs.
The overall effect was little change in incomes – a 1% fall meaning tillage, on average, is by far the second most profitable sector.
One noteworthy item is the 9% fall in subsidies last year.
The Ciolos reforms will hit tillage farms pretty hard, with a 20% further drop coming for many, even if greening payments are retained.
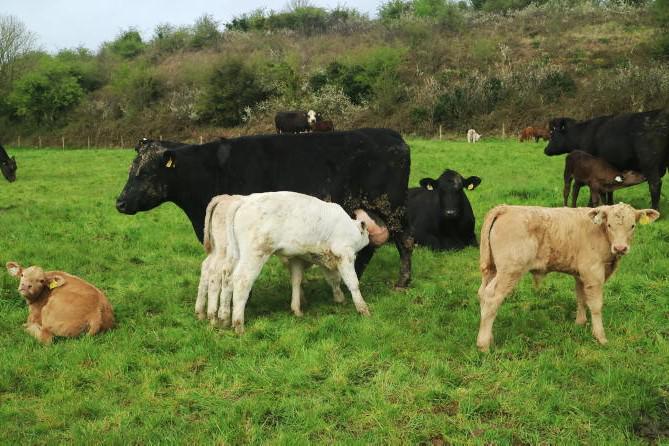
The 15,000 suckler farms surveyed had a better year, with incomes up 8%.
However, this still leaves an overall income of barely over €10,000.
Again, costs were down, with output up as cattle thrived in the great grazing season.
Fodder costs fell by a third, with concentrate spend down 18%. With the survey showing almost a full family labour unit on these farms, it’s not surprising that they also exhibit the highest off-farm income figures.
This group is the largest in number, with 25,674 non-suckler beef farms in Ireland.
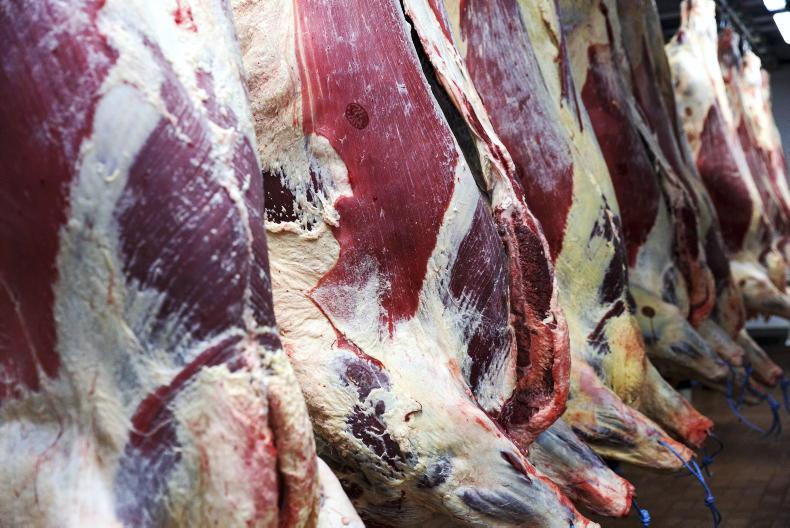
While incomes are higher than on suckler farms, they fell last year, a result of the lower factory beef prices that eventually led to direct farmer action being taken in the closing months of 2014.
Costs were down by 15%, which was actually by more than other systems, but output was down by 9% in value terms – completely due to an 11% price drop.
The 13,000 sheep farms surveyed saw incomes increase by a quarter, but that was on the back of a very poor 2013.
Output was €47,293, with prices up 5% and production up 3%. Costs were down 6%, leaving income up by 24%.
Sheep farmers can look forward to increases in direct payments under the reformed CAP, but the most intensive sheep farms are less likely to benefit in any way from this.
Currently, direct payments average €205/ha on sheep farms, the lowest of all enterprises.
The remaining 2,760 farms fall under the “mixed livestock” category.
These are predominantly dairy farms with a beef enterprise, and show significant scope for dairy expansion. Average farm size is 64 ha, with 45 cows and a further 64 livestock units on the farm.
These farms are well placed to drive dairy expansion and are probably already doing so.
The income figures are for total family farm income. These must be examined against total labour input into the farm system.
Dairy farms have the highest labour input at 1.84 units. When we strip out the 0.24 of paid hired labour, we have 1.6 units of unpaid family labour, who must live from the family farm income. This leaves €43,048 per labour unit.
Tillage farms fare almost as well from this perspective.
Drystock farms have a typical labour requirement of one person per farm, earning a mere fraction of the average industrial income.
Each year, Teagasc intensively surveys 1,000 Irish farms, chosen by size, location, and enterprise to demographically represent 80,000 Irish farms.
The pig, poultry, horse and horticulture sectors are excluded, as are “very small farms” – up to 50,000 of them, a stark reminder of the viability of over one-third of all holdings.
The figures would suggest that the vast majority of these farms are drystock – either sheep, cattle, or a little of both.
SHARING OPTIONS