It was one of the best yield years on record and yet one of the most frequent questions that growers ask is “Is there a future in tillage?”
We can argue that the same question has been asked for decades and yet we are still here but the balance of risk has changed very much against the grower. A similar risk applies to the merchant trade which supplies much of the credit to finance the production of our 2.5m tonnes of grain.
While the question about the future is a long-running one, it is still useful to look at where the price/cost squeeze is coming from. After crop choice, yield, price and quality are the three main components of gross output.
Every grower aims to do as much as is practically possible to secure yield and quality but price has very much gone out of his/her control. It is important to remember that prices were supported directly for a number of years after we joined the EEC but since 1993 production support has been provided as a direct area subsidy and now imported grains can enter freely and compete.
Our historic prices
It is interesting to look at the price movements through the years. These are not always easy to lay one’s hands on and I am grateful to Tom Beausang, a grower from Co Waterford, for the use of his figures in this article. While no system of price or cost comparison is perfect, the fact that the grain prices used here are from one grower should indicate the trend but actual prices may have been slightly higher or lower elsewhere in the country.
Would it shock you to be reminded that the price of green feeding barley in 1979 was €114.28/t at 20% moisture? If that was a shock, then you had better sit down because the average feed barley price level over the next 37 years works out at €122.88/t at 20% moisture. There were years when prices were much better but also some which were worse. The price trend over the years is shown in Figure 1.
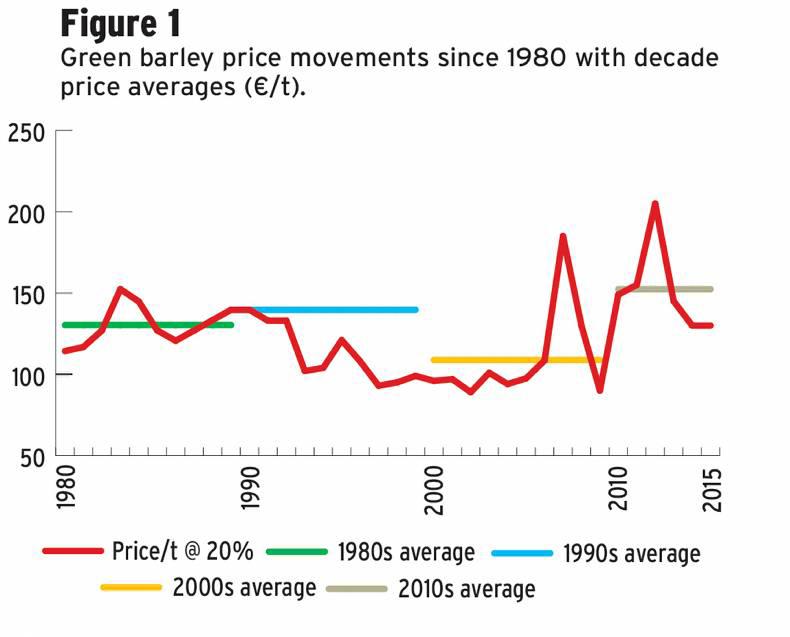
The instant observation is that prices were much higher in the 1980s and early 1990s. During this period, intervention was a real price support mechanism but this was replaced by income support and area aid from 1993 onwards. During the remainder of the 1990s and the first half of the 2000s, prices were largely static and on the floor.
From 2005 onwards, EU income support was paid on an area basis regardless of what crop was produced and intervention was gone. By this time, producers all over the globe were restricting production because the price levels available made no economic sense.
From the early 2000s, the US bioethanol sector was getting into gear and global demand for grains was rising annually. This gave rise to a period of intense price volatility as shown by the price hikes in 2007 and 2012.
Since the mid 2000s, prices have moved up a gear and this is reflected in the average of €152.33 since 2010. This followed a very low average of €108.79 for the 2000s, which included the exceptional price of €185/t in 2007 following the poor harvest in Russia.
On the face of it, the shape of the price line in Figure 1 would indicate that things might have improved in tillage from 2010 onwards. But this has not been the case because yield levels remained largely flat and cost levels increased substantially following the price hike in 2007. So it now takes a higher price just to pay the bills and profit continues to suffer. The big problem with a high cost base is that a bad yield year can leave very big debts and this adds a new risk level.
Production costs
A parallel problem was that overall production costs continued to increase during all of this period and especially from the early 2000s onwards. Production costs vary considerably from farm to farm and from year to year so the overall trend for the period is best shown by using the production costs used in Teagasc’s Crop Costs and Returns handbooks.
However, while these contain values for inputs such as machinery, fertiliser, seed, chemicals, etc, plus the costs of doing the work, they do not include a fixed costs estimate or any indicator to reflect the increasing cost of living which occurred in the 2000s. Both of these increased substantially during the 2000s to further erode potential profit.
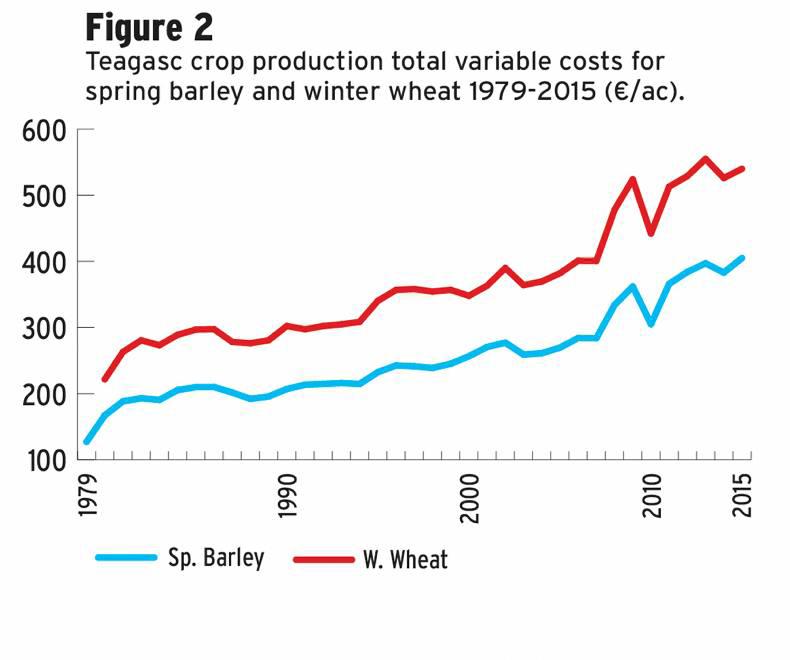 The Teagasc variable cost estimates are shown in Figure 2. While these are cost estimates for the year ahead, they do serve as a good indicator of production costs on most farms and growers are challenged to meet and beat these costs. It must also be said that a small proportion of growers have cost levels that are lower than these due to attention to detail over time and the frequent use of organic manures.
Figure 2 shows that production costs remained largely flat from the early 1980s to the early ’90s, with small nominal increases taking place. But from 2007 onwards costs began to increase more rapidly. There were a number of factors here but a significant one was the need for higher fertiliser rates to offset falling soil fertility indices.
There was a relatively large increase in costs in 1995 and 1996 which came about as a result of increases in fertiliser, chemical and machinery costs. There was a further significant price hike in 2011, especially in fertiliser.
Whatever about the absolute accuracy of the specific figures in Figure 2, there is no getting away from the underlying trend of increasing costs. And when this is viewed alongside the price graph in Figure 1 it is easy to see why margins have been eroded.
Fertiliser prices
Tom Beausang also had information on fertiliser prices since the 1980s but this information is not complete because different products were used in different years. Still, Tom’s information clearly shows the price trend. Prices of individual products were up and down over the past 35 years and this is best seen in the case of CAN+S and 14:7:14 in Figure 3.
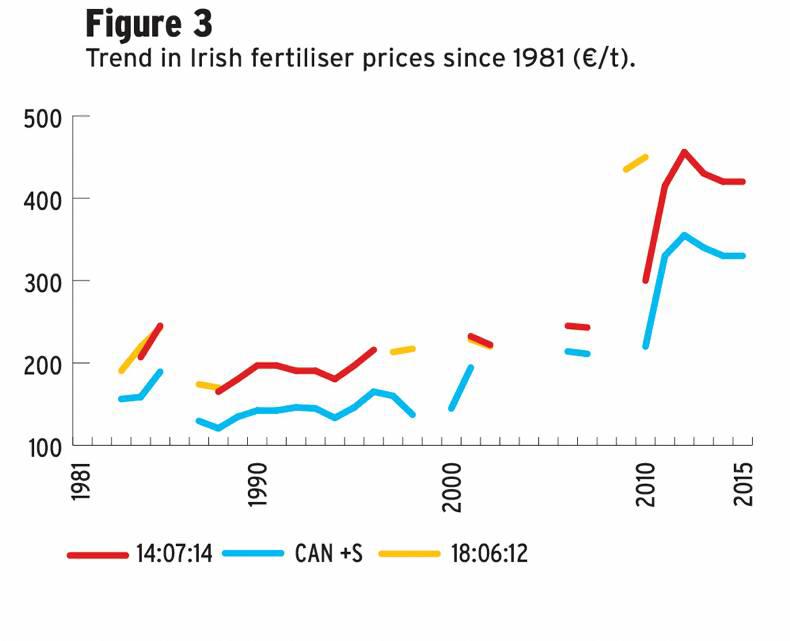
Since 2010/’11 fertiliser prices have rocketed and this is being felt in production costs. One might argue that this had actually been happening since the start of the 2000s when consolidation in that industry led to an end to oversupply and an ability to control prices to help protect margins.
The impact on margins
These ongoing trends of increasing costs and an almost flat product price over time have led to the continuous erosion of margin potential in crop production. The escalating cost of land rental in recent years has further exacerbated the margin problem.
Tom gave me a cost and margin comparison from the beginning and the end of the period covered, which had been completed by Teagasc. I will again emphasise that these figures do not include any value for fixed costs, which also increased substantially during this era. Neither do these costs include any payment for own labour or any return on own skills.
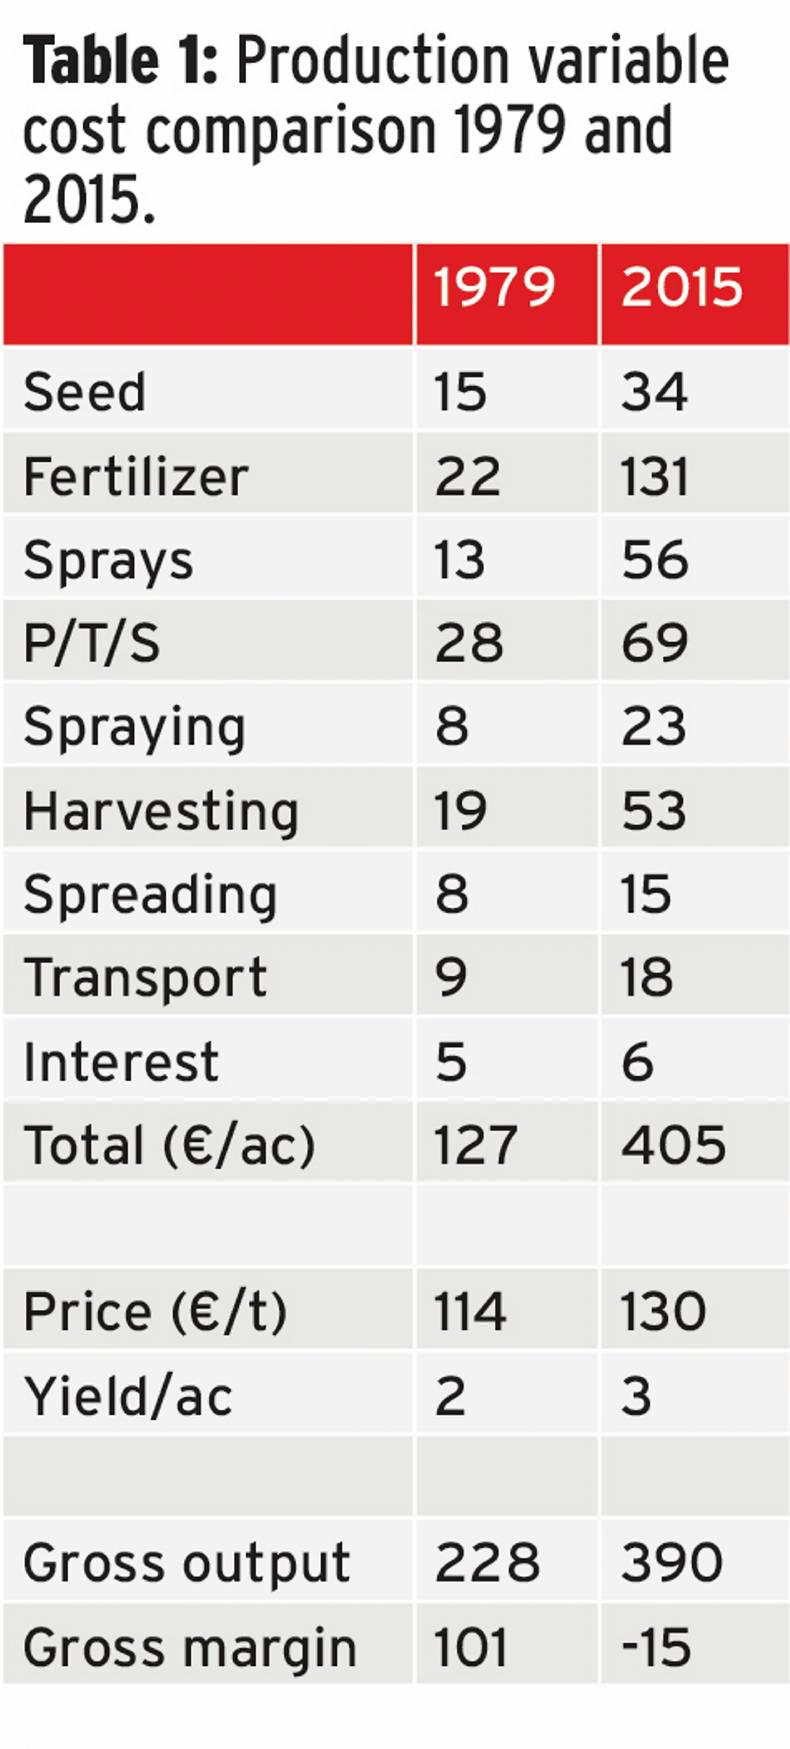 But in terms of the Teagasc methodology for such comparisons, the numbers in Table 1 tell a story. It might not be totally unreasonable to see a doubling of cost level in some of these items over this 35-year period, but many items have far more than doubled. Fertiliser cost is perhaps the most dramatic increase and this is primarily due to an increase in the price of the products used and a slight increase in rates. The sheer magnitude of unit cost increases in seen in Table 1.
Spray costs have increased more than fourfold, but this is primarily due to an increasing dependence on chemicals to solve an ever-increasing range of problems. Machinery work more than doubled in cost. And the bottom line is that the total variable costs associated with growing an acre of spring barley has risen from €127 per acre back in 1979 to €405/ac today. This is more than a trebling in our cost base against what is largely a flat price.
If we ignore production support and straw value, the gross output will have increased from €228/ac in 1979 to €390/ac in 2015 based on a 2t/ac crop in 1979 and 3t/ac in 2015. But despite the productivity increase during the period, the gross margin calculated on owned land dropped from €101/ac in 1979 to a loss of €15/ac in the last harvest (before aid).
The figures shown in this article point to two immediate courses of action for serious growers. Try and do some sensible forward selling when an opportunity exists to help your average price. Do what is necessary to get your yield levels up to what your genetics are capable of by improving the land you are using. And the bottom line is “Don’t plant areas that will not yield”.
The average price for green spring barley since 1979 is €122.88/t and productivity increases have been critical to keeping growers in business.Yield is key to profitability and we must improve our soils to produce the genetic potential of the varieties we grow. Production costs continue to increase and have been accelerated in recent years due to the high cost of fertiliser in particular.
It was one of the best yield years on record and yet one of the most frequent questions that growers ask is “Is there a future in tillage?”
We can argue that the same question has been asked for decades and yet we are still here but the balance of risk has changed very much against the grower. A similar risk applies to the merchant trade which supplies much of the credit to finance the production of our 2.5m tonnes of grain.
While the question about the future is a long-running one, it is still useful to look at where the price/cost squeeze is coming from. After crop choice, yield, price and quality are the three main components of gross output.
Every grower aims to do as much as is practically possible to secure yield and quality but price has very much gone out of his/her control. It is important to remember that prices were supported directly for a number of years after we joined the EEC but since 1993 production support has been provided as a direct area subsidy and now imported grains can enter freely and compete.
Our historic prices
It is interesting to look at the price movements through the years. These are not always easy to lay one’s hands on and I am grateful to Tom Beausang, a grower from Co Waterford, for the use of his figures in this article. While no system of price or cost comparison is perfect, the fact that the grain prices used here are from one grower should indicate the trend but actual prices may have been slightly higher or lower elsewhere in the country.
Would it shock you to be reminded that the price of green feeding barley in 1979 was €114.28/t at 20% moisture? If that was a shock, then you had better sit down because the average feed barley price level over the next 37 years works out at €122.88/t at 20% moisture. There were years when prices were much better but also some which were worse. The price trend over the years is shown in Figure 1.
The instant observation is that prices were much higher in the 1980s and early 1990s. During this period, intervention was a real price support mechanism but this was replaced by income support and area aid from 1993 onwards. During the remainder of the 1990s and the first half of the 2000s, prices were largely static and on the floor.
From 2005 onwards, EU income support was paid on an area basis regardless of what crop was produced and intervention was gone. By this time, producers all over the globe were restricting production because the price levels available made no economic sense.
From the early 2000s, the US bioethanol sector was getting into gear and global demand for grains was rising annually. This gave rise to a period of intense price volatility as shown by the price hikes in 2007 and 2012.
Since the mid 2000s, prices have moved up a gear and this is reflected in the average of €152.33 since 2010. This followed a very low average of €108.79 for the 2000s, which included the exceptional price of €185/t in 2007 following the poor harvest in Russia.
On the face of it, the shape of the price line in Figure 1 would indicate that things might have improved in tillage from 2010 onwards. But this has not been the case because yield levels remained largely flat and cost levels increased substantially following the price hike in 2007. So it now takes a higher price just to pay the bills and profit continues to suffer. The big problem with a high cost base is that a bad yield year can leave very big debts and this adds a new risk level.
Production costs
A parallel problem was that overall production costs continued to increase during all of this period and especially from the early 2000s onwards. Production costs vary considerably from farm to farm and from year to year so the overall trend for the period is best shown by using the production costs used in Teagasc’s Crop Costs and Returns handbooks.
However, while these contain values for inputs such as machinery, fertiliser, seed, chemicals, etc, plus the costs of doing the work, they do not include a fixed costs estimate or any indicator to reflect the increasing cost of living which occurred in the 2000s. Both of these increased substantially during the 2000s to further erode potential profit.
The Teagasc variable cost estimates are shown in Figure 2. While these are cost estimates for the year ahead, they do serve as a good indicator of production costs on most farms and growers are challenged to meet and beat these costs. It must also be said that a small proportion of growers have cost levels that are lower than these due to attention to detail over time and the frequent use of organic manures.
Figure 2 shows that production costs remained largely flat from the early 1980s to the early ’90s, with small nominal increases taking place. But from 2007 onwards costs began to increase more rapidly. There were a number of factors here but a significant one was the need for higher fertiliser rates to offset falling soil fertility indices.
There was a relatively large increase in costs in 1995 and 1996 which came about as a result of increases in fertiliser, chemical and machinery costs. There was a further significant price hike in 2011, especially in fertiliser.
Whatever about the absolute accuracy of the specific figures in Figure 2, there is no getting away from the underlying trend of increasing costs. And when this is viewed alongside the price graph in Figure 1 it is easy to see why margins have been eroded.
Fertiliser prices
Tom Beausang also had information on fertiliser prices since the 1980s but this information is not complete because different products were used in different years. Still, Tom’s information clearly shows the price trend. Prices of individual products were up and down over the past 35 years and this is best seen in the case of CAN+S and 14:7:14 in Figure 3.
Since 2010/’11 fertiliser prices have rocketed and this is being felt in production costs. One might argue that this had actually been happening since the start of the 2000s when consolidation in that industry led to an end to oversupply and an ability to control prices to help protect margins.
The impact on margins
These ongoing trends of increasing costs and an almost flat product price over time have led to the continuous erosion of margin potential in crop production. The escalating cost of land rental in recent years has further exacerbated the margin problem.
Tom gave me a cost and margin comparison from the beginning and the end of the period covered, which had been completed by Teagasc. I will again emphasise that these figures do not include any value for fixed costs, which also increased substantially during this era. Neither do these costs include any payment for own labour or any return on own skills.
But in terms of the Teagasc methodology for such comparisons, the numbers in Table 1 tell a story. It might not be totally unreasonable to see a doubling of cost level in some of these items over this 35-year period, but many items have far more than doubled. Fertiliser cost is perhaps the most dramatic increase and this is primarily due to an increase in the price of the products used and a slight increase in rates. The sheer magnitude of unit cost increases in seen in Table 1.
Spray costs have increased more than fourfold, but this is primarily due to an increasing dependence on chemicals to solve an ever-increasing range of problems. Machinery work more than doubled in cost. And the bottom line is that the total variable costs associated with growing an acre of spring barley has risen from €127 per acre back in 1979 to €405/ac today. This is more than a trebling in our cost base against what is largely a flat price.
If we ignore production support and straw value, the gross output will have increased from €228/ac in 1979 to €390/ac in 2015 based on a 2t/ac crop in 1979 and 3t/ac in 2015. But despite the productivity increase during the period, the gross margin calculated on owned land dropped from €101/ac in 1979 to a loss of €15/ac in the last harvest (before aid).
The figures shown in this article point to two immediate courses of action for serious growers. Try and do some sensible forward selling when an opportunity exists to help your average price. Do what is necessary to get your yield levels up to what your genetics are capable of by improving the land you are using. And the bottom line is “Don’t plant areas that will not yield”.
The average price for green spring barley since 1979 is €122.88/t and productivity increases have been critical to keeping growers in business.Yield is key to profitability and we must improve our soils to produce the genetic potential of the varieties we grow. Production costs continue to increase and have been accelerated in recent years due to the high cost of fertiliser in particular. 


SHARING OPTIONS