In 2015, the collective cereal, oilseed and protein crop producing power of all 28 EU member states amounted to 346m tonnes. This was an increase of 11% from around 312m tonnes in 2005.
However, one of the more overlooked aspects of the European cereal, oilseed and protein crop (COP) production model is the storage and logistical infrastructure which underpins the entire sector.
In the first European wide study of its kind, a new report detailed the storage capacity and logistical infrastructure for COP in the EU and tracked its evolution since 2005.
Cereal, oilseed and protein crop storage
Across all EU 28 member states, storage capacity of COP amounts to 359m tonnes. This is an increase of 20% from 300m tonnes since 2005.
The combined effect of growth in COP yields and production, increasing exports, increased volatility of domestic and international prices, the switch to just-in-time inventory management models and the need for greater strategic stock management were some of the key drivers for the expansion of storage capacity within the EU 28.
The report mapped nearly 18,000 storage facilities which were divided into such as individual farm storage, those operated by farming cooperatives, those managed by operators processing COP into food/feed products, those managed by traders and wholesalers of grains and those operating at transportation hubs such as seaports, inland waterway ports and railway terminals.
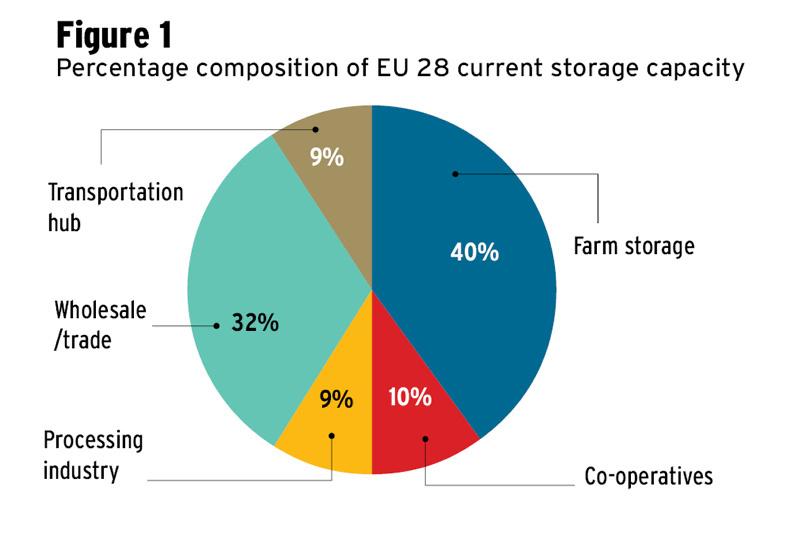
The results make for interesting reading and are represented in Figure 1. Facilities at individual farm level currently account for 40% of EU storage capacity (143m tonnes). The share of on-farm storage is substantially higher in Finland (78%), Greece (70%) and the United Kingdom (62%) than the EU 28 average.
Storage capacity at farming co-operatives accounts for 11% of the EU total (38m tonnes), while the processing industry manages around 31.5m tonnes, equal to 9% of the EU total.
The trading and wholesale sector was also found to have an important role is COP storage, accounting for 32% of the EU total (115.5m tonnes).
Finally, the total capacity of storage facilities at transportation hubs amounted to 31m tonnes, or 9% of the EU total.
All 28 member states increased their storage capacity over the observed period, with the exception of Spain (which recorded a 33% decrease). Significant increases were recorded in eastern EU member states. These sellers typically export at a rapid pace early in the marketing year and sometimes act as a transhipment route for grain out of neighbouring Russia.
Bulgaria more than doubled its storage capacity, Poland increased by around 57% and Latvia by 52%. Increases above 40% were also recorded in Greece, Sweden and Romania.
France is the member state with by far the largest storage capacity (around 91m tonnes in 2015), followed by Germany (48m tonnes) and Spain (30m tonnes).
The report suggests that, generally speaking, investments in storage capacity are more likely to be determined by average production levels plus a security buffer (eg +20%). Operators tend to avoid investing in storage capacity which would not be used most of the time. Findings from the report indicate that the EU’s storage needs for indigenous COP production are more than adequate.
EU transportation of COP
The report highlights the strategic importance of having a well-functioning logistics system as around four million tonnes of grains worth over €1bn are moved within the EU every week.
Road, rail and inland waterways play different roles in the transportation of COP crops from EU cultivation areas to their final destinations. Inland waterways and railways handle most of the long-distance COP transport in the EU (60% to 70% for inland waterways, 30% to 40% for railways). Trucks play a minor role in long-haul transport but play a significant role in short-haul transportation.
The study identified four main transport corridors for cereals, oilseeds and protein crops in Europe: Baltic-Adriatic; North-Sea Baltic; Rhine-Alpine and Rhine-Danube.
However, across all four transport corridors and all three transportation modes, significant bottlenecks emerged. For example, capacity issues with the transportation network in terms of German and Austrian cross-border railway connections emerged as an issue. Traffic congestion was also highlighted as an issue on EU motorways, restricting transport flows and causing higher transportation costs.
For seven EU member states (Belgium, Germany, Ireland, Italy, Lithuania, Poland and United Kingdom) traffic congestion results in costs of more than 1% of annual GDP.
Some of the suggested solutions to address these infrastructural bottlenecks included the completion of missing links in the main COP transportation corridors, capacity increases and technological upgrade on critical corridor sections.
How does Ireland compare?
The report states that Ireland has increased its storage capacity by 23% to 2.6m tonnes over the 10 years from 2005 to 2015, with the highest quantity of COP stored on merchants’ premises. This is slightly above the EU average. Ireland’s main transport method is, as one would expect, road transportation methods. However, congestion on road networks is costing the state significant sums of money. Table 1 shows the average delay per kilometre (in seconds) in Ireland for roads with a free flow speed of >50 km/h, >80 km/h and >100 km/h, in three-hour moving averages.
Ireland has the largest average delay due to congestion when travelling on roads which were rated 50km/h or under out of the EU 28 (Table 1).
Ireland fared average in the other categories. The reports estimates that congestion is costing up to 1.1% of the country’s GDP.
Read more
How Russia built a wheat empire
Grain store’s state-of-the-art construction
In 2015, the collective cereal, oilseed and protein crop producing power of all 28 EU member states amounted to 346m tonnes. This was an increase of 11% from around 312m tonnes in 2005.
However, one of the more overlooked aspects of the European cereal, oilseed and protein crop (COP) production model is the storage and logistical infrastructure which underpins the entire sector.
In the first European wide study of its kind, a new report detailed the storage capacity and logistical infrastructure for COP in the EU and tracked its evolution since 2005.
Cereal, oilseed and protein crop storage
Across all EU 28 member states, storage capacity of COP amounts to 359m tonnes. This is an increase of 20% from 300m tonnes since 2005.
The combined effect of growth in COP yields and production, increasing exports, increased volatility of domestic and international prices, the switch to just-in-time inventory management models and the need for greater strategic stock management were some of the key drivers for the expansion of storage capacity within the EU 28.
The report mapped nearly 18,000 storage facilities which were divided into such as individual farm storage, those operated by farming cooperatives, those managed by operators processing COP into food/feed products, those managed by traders and wholesalers of grains and those operating at transportation hubs such as seaports, inland waterway ports and railway terminals.
The results make for interesting reading and are represented in Figure 1. Facilities at individual farm level currently account for 40% of EU storage capacity (143m tonnes). The share of on-farm storage is substantially higher in Finland (78%), Greece (70%) and the United Kingdom (62%) than the EU 28 average.
Storage capacity at farming co-operatives accounts for 11% of the EU total (38m tonnes), while the processing industry manages around 31.5m tonnes, equal to 9% of the EU total.
The trading and wholesale sector was also found to have an important role is COP storage, accounting for 32% of the EU total (115.5m tonnes).
Finally, the total capacity of storage facilities at transportation hubs amounted to 31m tonnes, or 9% of the EU total.
All 28 member states increased their storage capacity over the observed period, with the exception of Spain (which recorded a 33% decrease). Significant increases were recorded in eastern EU member states. These sellers typically export at a rapid pace early in the marketing year and sometimes act as a transhipment route for grain out of neighbouring Russia.
Bulgaria more than doubled its storage capacity, Poland increased by around 57% and Latvia by 52%. Increases above 40% were also recorded in Greece, Sweden and Romania.
France is the member state with by far the largest storage capacity (around 91m tonnes in 2015), followed by Germany (48m tonnes) and Spain (30m tonnes).
The report suggests that, generally speaking, investments in storage capacity are more likely to be determined by average production levels plus a security buffer (eg +20%). Operators tend to avoid investing in storage capacity which would not be used most of the time. Findings from the report indicate that the EU’s storage needs for indigenous COP production are more than adequate.
EU transportation of COP
The report highlights the strategic importance of having a well-functioning logistics system as around four million tonnes of grains worth over €1bn are moved within the EU every week.
Road, rail and inland waterways play different roles in the transportation of COP crops from EU cultivation areas to their final destinations. Inland waterways and railways handle most of the long-distance COP transport in the EU (60% to 70% for inland waterways, 30% to 40% for railways). Trucks play a minor role in long-haul transport but play a significant role in short-haul transportation.
The study identified four main transport corridors for cereals, oilseeds and protein crops in Europe: Baltic-Adriatic; North-Sea Baltic; Rhine-Alpine and Rhine-Danube.
However, across all four transport corridors and all three transportation modes, significant bottlenecks emerged. For example, capacity issues with the transportation network in terms of German and Austrian cross-border railway connections emerged as an issue. Traffic congestion was also highlighted as an issue on EU motorways, restricting transport flows and causing higher transportation costs.
For seven EU member states (Belgium, Germany, Ireland, Italy, Lithuania, Poland and United Kingdom) traffic congestion results in costs of more than 1% of annual GDP.
Some of the suggested solutions to address these infrastructural bottlenecks included the completion of missing links in the main COP transportation corridors, capacity increases and technological upgrade on critical corridor sections.
How does Ireland compare?
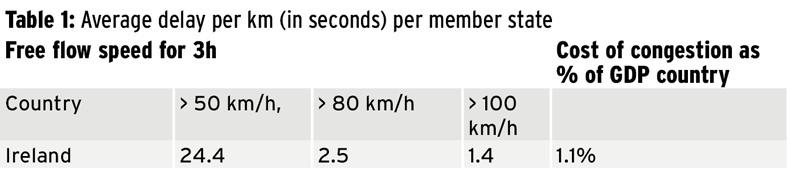
The report states that Ireland has increased its storage capacity by 23% to 2.6m tonnes over the 10 years from 2005 to 2015, with the highest quantity of COP stored on merchants’ premises. This is slightly above the EU average. Ireland’s main transport method is, as one would expect, road transportation methods. However, congestion on road networks is costing the state significant sums of money. Table 1 shows the average delay per kilometre (in seconds) in Ireland for roads with a free flow speed of >50 km/h, >80 km/h and >100 km/h, in three-hour moving averages.
Ireland has the largest average delay due to congestion when travelling on roads which were rated 50km/h or under out of the EU 28 (Table 1).
Ireland fared average in the other categories. The reports estimates that congestion is costing up to 1.1% of the country’s GDP.
Read more
How Russia built a wheat empire
Grain store’s state-of-the-art construction


SHARING OPTIONS