

A new report by the EPA shows that the nitrogen load reductions required in Irish rivers to support good ecological status in estuaries has decreased, compared to previous assessments. The new report incorporates 2022 to 2024 river water quality and shows that seven of the 12 major rivers analysed require a reduction in nitrogen load, compared to 10 rivers during the 2017 to 2019 assessment period.
The quantity of nitrogen load reductions required has fallen for all river bodies with the exception of the Blackwater, which has seen its load reduction requirement increase. The analysis is carried out by the EPA using data from nitrogen concentrations in the water and the flow of water in the river to quantify the load.
Based on this data, it can determine by how much the nitrogen load needs to reduce by in order to ensure good ecological status in estuaries.
As expected, the rivers in the south east require the greatest load reductions while rivers in the western seaboard require no reductions.
Interestingly, the Deel river in Limerick required a 20% reduction in the last assessment, but has a zero-reduction requirement now. Table 1 outlines the percentage reduction in nitrogen load required by each river.
The rivers with by far the highest load reduction requirements are the Barrow at 38%, the Slaney at 31% and the Nore at 16%. The Suir requires just a 2% nitrogen load reduction, while the Bandon requires an 8% reduction.
In relation to the Blackwater, the EPA report references the increase in load reduction required. The report states that nutrient losses in the Blackwater were at their highest in the 1990’s and 2000s but improved to a satisfactory condition in the mid-2010s only to deteriorate again in the late 2010s.
The report says that this highlights two points. Firstly, Ireland’s shallow geological system and high rainfall flushes nutrients quickly “enabling ecological recovery within a decade”. Secondly, the report states that improvements need to be maintained once achieved.
In relation to the Slaney and the Barrow, the report states the high load reduction requirement is down to a large agricultural footprint within the catchments, nutrient pressures and low effective rainfall.
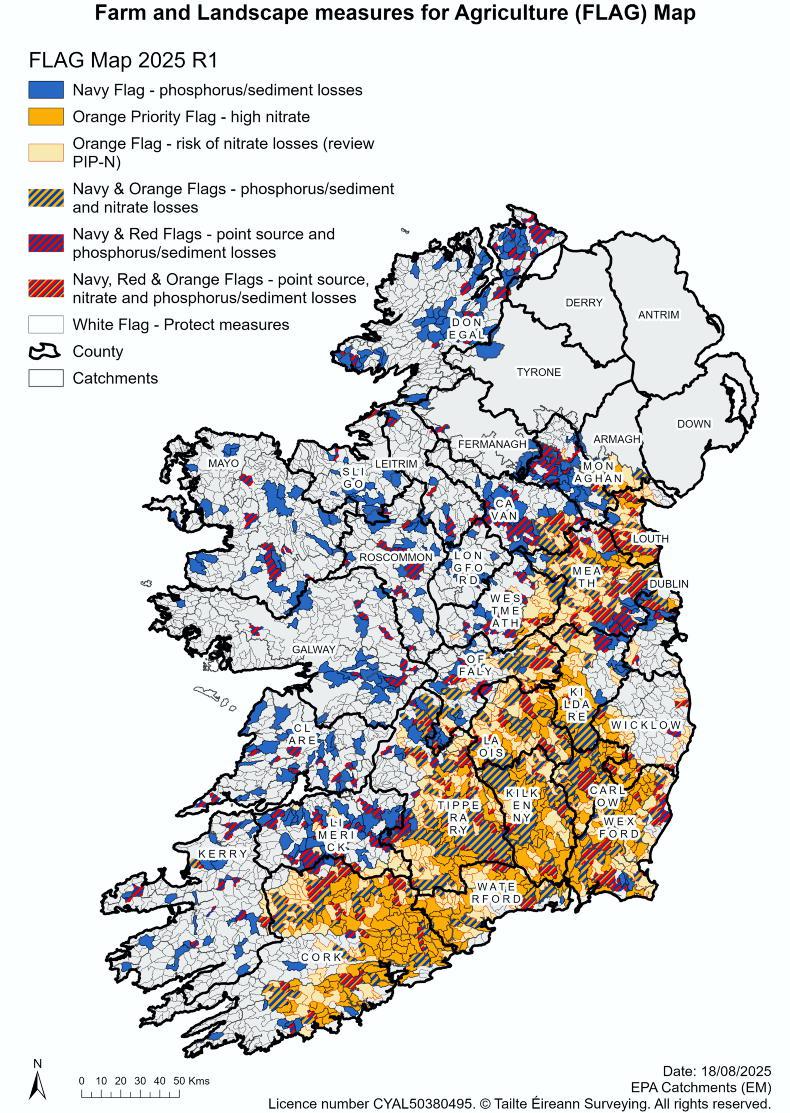
FLAG
The EPA has also published a new Farm and Landscapes measures for Agriculture (FLAG) map updated for 2025. This map highlights the pollution impact potential for nitrogen, phosphorus/sediment and point source pollution such as run-off from farm yards, etc.
The new map shows the parts of the country where nitrogen losses are a risk (orange) and a priority (dark orange). In some catchments both nitrogen and phosphorus/sediment (blue) are risks and these are marked by both orange and blue colours.
The map highlights that anyone farming within the coloured zones is at high risk of causing pollution.
Those in the high risk for nitrogen loss areas need to be concerned about reducing nitrogen surplus, while those in the blue areas need to be concerned about preventing overland flow and soil erosion.
Those in the white areas need to protect the good water quality in that sub-catchment.
You can access the EPA FLAG map


SHARING OPTIONS