

TheEnvironmental Protection Agency (EPA) has designed “pollution impact potential maps” for phosphorus and nitrogen.
Across the country, 1,007 waterbodies are affected by excess phosphorus (P), while 535 are impacted by excess nitrogen (N), including 18 drinking water supplies.
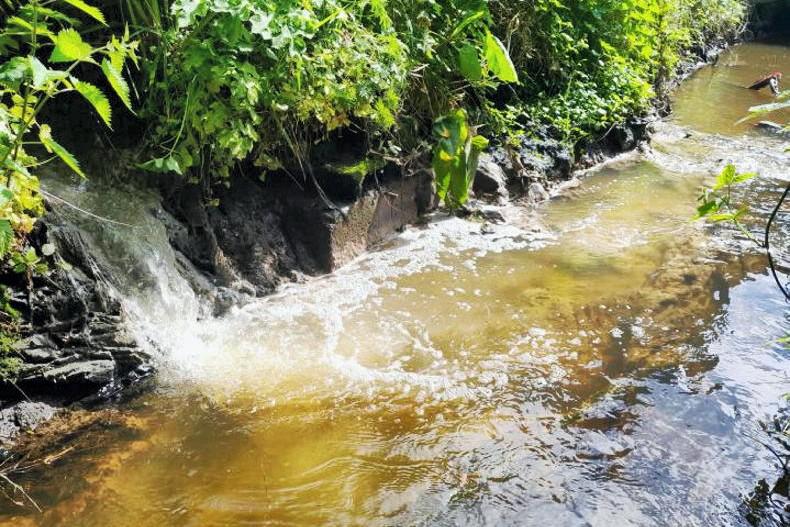
Some 2,400km or under 2% of river banks have been identified as needing pathway interception measures for P.
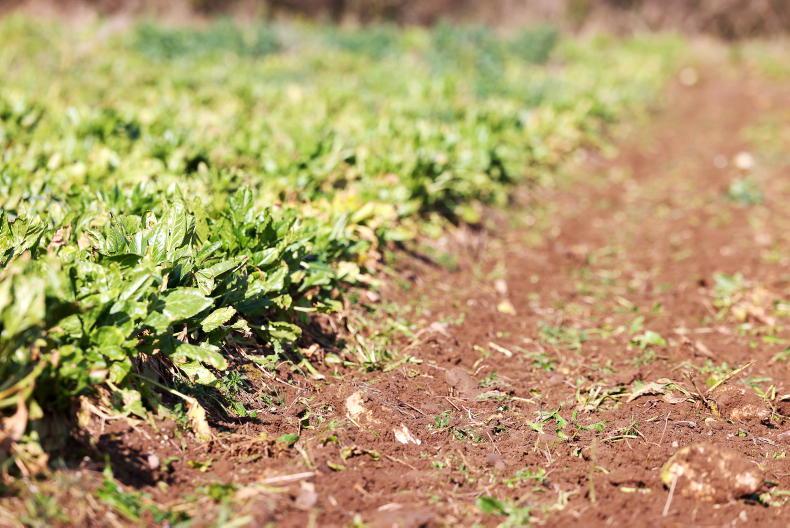
Some 6,900km2 of highest-risk critical source areas were also outlined where nitrate losses from farms are highest in the south and southeast.
Key to preventing loss, according to Jenny Deakin of the EPA, who was speaking at a Teagasc Signpost Series webinar, is using “the right measure in the right place” and these maps will help to target zones vulnerable to loss.
Deakin said the areas outlined in these new maps as high risk are not necessarily causing a problem – but they are the first places to look if there is a problem.
Looking at P loss, the maps use factors including bedrock, subsoil type, soil type, hydro(geo)logical susceptibility and LPIS and AIMS data to identify the pollution impact potential of P. The map also outlines delivery paths, delivery points, where overland pathways intersect with streams and rivers.
Importantly, a red dot shows where a “break the pathway measure” is needed. These measures may include a buffer zone, woodland, engineered ponds, ditches or wetlands.
The pollution impact potential map for nitrate uses land use and stocking data from the Department of Agriculture, along with a farm management and leaching model and a susceptibility map based on Geological Survey of Ireland and EPA data to calculate the pathway and losses.
Deakin highlighted multispecies swards, low-emissions slurry spreading equipment and improving soil fertility as some of the measures to reduce nitrogen use on farms and in turn nitrogen losses.
Positives
Overall agriculture is the biggest sector contributing to water quality status in this country and, as Deakin outlined, this makes sense as it is the most widespread land use.
However, it is not all negative – 190 priority areas for action were identified and work began to solve problems in these waterways in 2018. Improvements have been seen in these areas already.
SHARING OPTIONS