
Farmers can find out which actions they should prioritise to improve water quality in their area by searching for their farm on a new map feature published by the Environmental Protection Agency (EPA).
The map outlines whether it is nitrogen or phosphate/sediment losses to water that is the main pressure on water in your catchment.
EPA testing has identified agriculture as being the primary pressure on 994 water bodies throughout Ireland - more than any other pressure type.
Nitrates losses
The EPA maps show that actions to prevent the loss of nitrogen should be concentrated on farms in the south and east.
Nitrogen is mainly lost in free-flowing soils with good drainage.
Areas with nitrogen losses - those showing on the map in blue - should improve soil fertility to reduce the amount of chemical nitrogen spread each year.
Soils at index three for P and K will require less nitrogen to maintain yield, as will soils with optimal pH.
The incorporation of clover also reduces dependency on spread nitrogen to grow covers.
Phosphate/sediment losses
The loss of P and sediment to waterways typically occurs on heavier soils, as is evidenced by the blue patches on the map being concentrated in the north and west.
Field runoff after slurry increases the loss of P to rivers and streams, making appropriate spreading conditions necessary to reducing the nutrient’s loss from fields.
Livestock, particularly cattle, draw soil sediment into streams when entering them to drink or to pass to another parcel of land.
Sediment has a negative impact on many invertebrate species which live in rivers, such as the pearl mussel.
The entry of sediment also contributes to the levels of phosphorous in waterways, as the nutrient binds to soil, but is released on entry into the water.
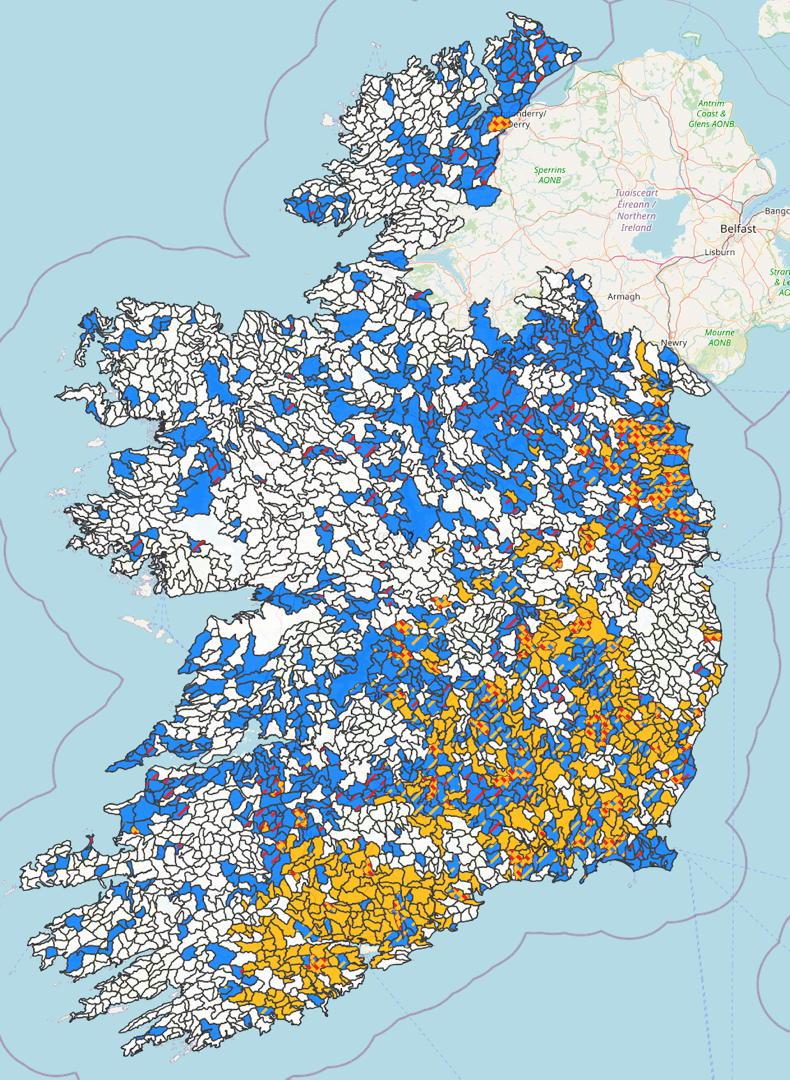
Map key
To see where your farm is on the map, click here.
To use the targeting agricultural measures filter, hover over the ‘taking action’ drop-down menu before the option will be displayed to you.