All river catchments monitored by the Environmental Protection Agency (EPA), except for the Blackwater, are now closer to meeting an important nitrates target needed to secure a further derogation.
This is according to new report on agricultural measures to reduce nitrates levels in rivers by the EPA.
The analysis compares results from the period 2022-2024 with 2017-2019, where the situation has improved almost unanimously.
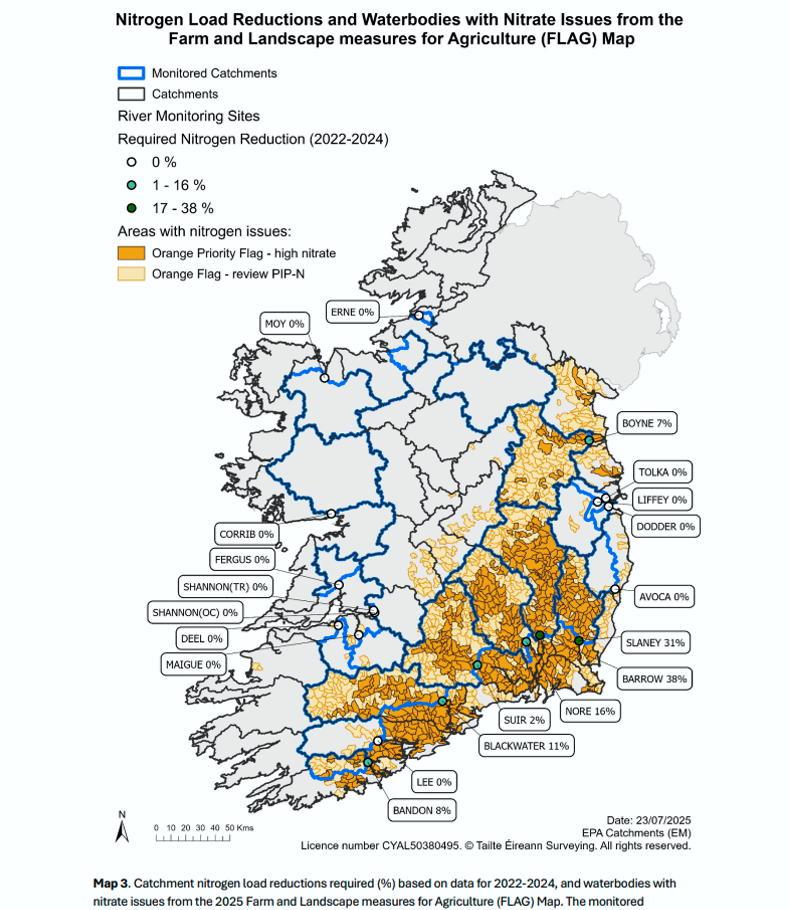
Some 13 stations have met their nitrogen targets. These are the Avoca, Corrib, Deel, Dodder, Erne, Fergus, Garavogue, Lee, Liffey, Maigue, Moy, Shannon and Tolka catchments.
“Ongoing action will be needed in freely draining agricultural areas to keep nitrogen at a sustainable level in catchments where the levels are close to the threshold. These include the Maigue/Deel, Liffey and Tolka catchments,” the report outlined.
Reductions required
On the other side of the coin, seven catchments still require nitrogen reductions. In the southeast, the Barrow is required to reduce its nitrogen load by 38%, down from the 42% reduction needed in 2017-2019.
The two other sisters faired slightly better. The Nore requires a 16% nitrogen load, while the Suir needs just a 2% drop to meet its nitrogen environmental objective.
Meanwhile, the Slaney must reduce nitrogen levels by 31% to meet the target.
A 7% fall in nitrogen load is required in the Bandon catchment, while a drop of 8% is needed in the Boyne.
The Munster Blackwater, the only river catchment to see its nitrogen load increase, now requires an 11% decrease, as opposed to the 6% drop that was needed between 2017-2019.
The EPA report noted that of the seven catchments that still need to reduce levels to meet water quality targets, the average nitrogen load reduction needed is 16%.
“However, the current results still fall short of the levels observed between 2008 and 2011, which remains the period when nitrogen levels were closest to meeting ecological targets over the past 35 years,” the EPA stated.
Country tells tale of two halves
Maps indicating the waterbodies with higher-than-required nitrogen levels tell a tale of two halves across the country.
Nitrates FLAG map.
Many catchments in the east and south require nitrogen reductions, while most in the southwest, west and northwest do not.
The EPA noted that some catchments do not require nitrogen reductions to meet estuarine water quality objectives.
“However, they do contain waterbodies with localised nitrate issues. Excess nitrate[s] in rivers also causes impacts to the local riverine ecology and reductions are therefore also needed in these areas,” it said.
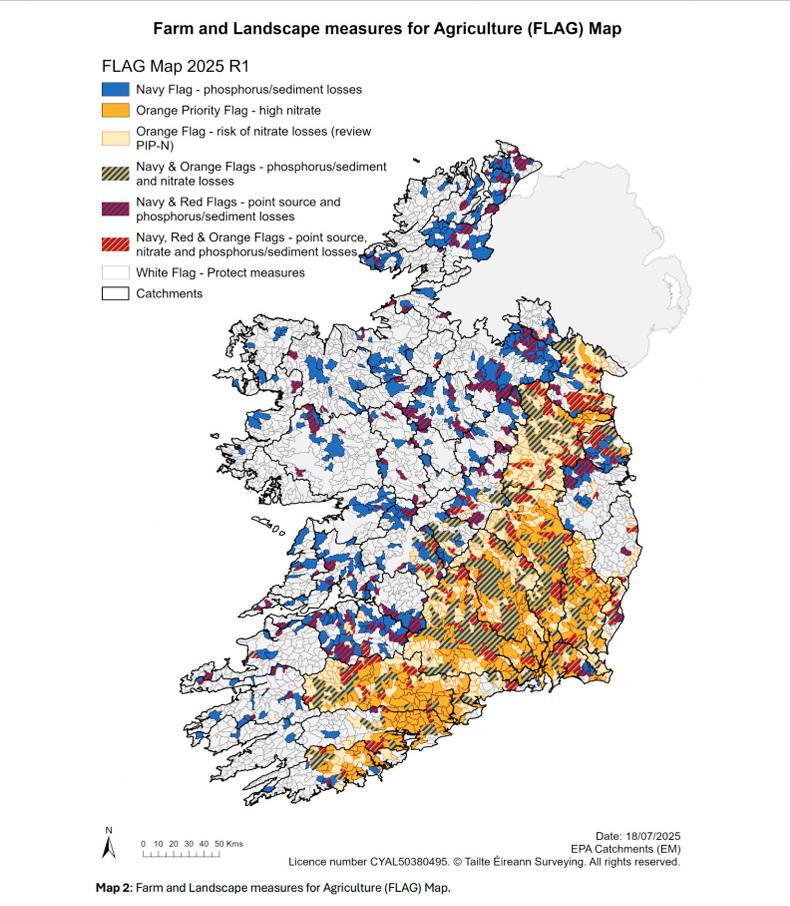
EPA FLAG map 2025.
Furthermore, in the Lee catchment, while nitrogen load reductions are needed, nitrogen targets have been met at the representative downstream river monitoring point.
“However, nitrogen levels are still elevated in some sub-catchments above the monitoring station and most sub-catchments below the river monitoring station.
“These areas are still contributing nitrate[s] to the estuary that is in unsatisfactory ecological condition. These sub-catchment areas are therefore highlighted in the FLAG map,” the report said.
The farm and landscape measures for agriculture (FLAG) map compiled by the EPA includes twice-yearly updates of the early insight indicator for nitrogen online mapping tool.
This was previously called the targeting agricultural measures map.
All river catchments monitored by the Environmental Protection Agency (EPA), except for the Blackwater, are now closer to meeting an important nitrates target needed to secure a further derogation.
This is according to new report on agricultural measures to reduce nitrates levels in rivers by the EPA.
The analysis compares results from the period 2022-2024 with 2017-2019, where the situation has improved almost unanimously.
Some 13 stations have met their nitrogen targets. These are the Avoca, Corrib, Deel, Dodder, Erne, Fergus, Garavogue, Lee, Liffey, Maigue, Moy, Shannon and Tolka catchments.
“Ongoing action will be needed in freely draining agricultural areas to keep nitrogen at a sustainable level in catchments where the levels are close to the threshold. These include the Maigue/Deel, Liffey and Tolka catchments,” the report outlined.
Reductions required
On the other side of the coin, seven catchments still require nitrogen reductions. In the southeast, the Barrow is required to reduce its nitrogen load by 38%, down from the 42% reduction needed in 2017-2019.
The two other sisters faired slightly better. The Nore requires a 16% nitrogen load, while the Suir needs just a 2% drop to meet its nitrogen environmental objective.
Meanwhile, the Slaney must reduce nitrogen levels by 31% to meet the target.
A 7% fall in nitrogen load is required in the Bandon catchment, while a drop of 8% is needed in the Boyne.
The Munster Blackwater, the only river catchment to see its nitrogen load increase, now requires an 11% decrease, as opposed to the 6% drop that was needed between 2017-2019.
The EPA report noted that of the seven catchments that still need to reduce levels to meet water quality targets, the average nitrogen load reduction needed is 16%.
“However, the current results still fall short of the levels observed between 2008 and 2011, which remains the period when nitrogen levels were closest to meeting ecological targets over the past 35 years,” the EPA stated.
Country tells tale of two halves
Maps indicating the waterbodies with higher-than-required nitrogen levels tell a tale of two halves across the country.
Nitrates FLAG map.
Many catchments in the east and south require nitrogen reductions, while most in the southwest, west and northwest do not.
The EPA noted that some catchments do not require nitrogen reductions to meet estuarine water quality objectives.
“However, they do contain waterbodies with localised nitrate issues. Excess nitrate[s] in rivers also causes impacts to the local riverine ecology and reductions are therefore also needed in these areas,” it said.
EPA FLAG map 2025.
Furthermore, in the Lee catchment, while nitrogen load reductions are needed, nitrogen targets have been met at the representative downstream river monitoring point.
“However, nitrogen levels are still elevated in some sub-catchments above the monitoring station and most sub-catchments below the river monitoring station.
“These areas are still contributing nitrate[s] to the estuary that is in unsatisfactory ecological condition. These sub-catchment areas are therefore highlighted in the FLAG map,” the report said.
The farm and landscape measures for agriculture (FLAG) map compiled by the EPA includes twice-yearly updates of the early insight indicator for nitrogen online mapping tool.
This was previously called the targeting agricultural measures map.


SHARING OPTIONS