

Grazing efficiency refers to how well grass swards are grazed by animals. Varieties with good grazing efficiency are grazed to a low post-grazing sward height (PostGSH). Varieties with poor grazing efficiency are grazed to high and uneven PostGSH and require mechanical correction such as topping to maintain quality. This study aimed to identify perennial ryegrass varieties with superior grazing efficiency.
Thirty perennial ryegrass varieties from the Irish Department of Agriculture Recommended List 2016 were sown and established in August 2016. Three replicates of each variety were sown. The study was conducted over the following two years, 2017 and 2018, with 19 grazing events taking place.
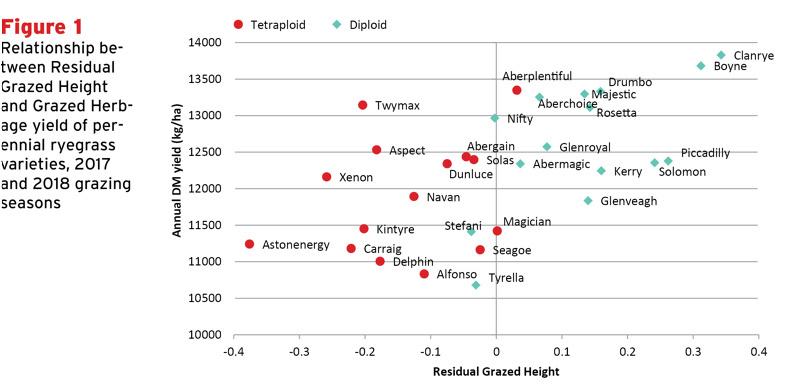
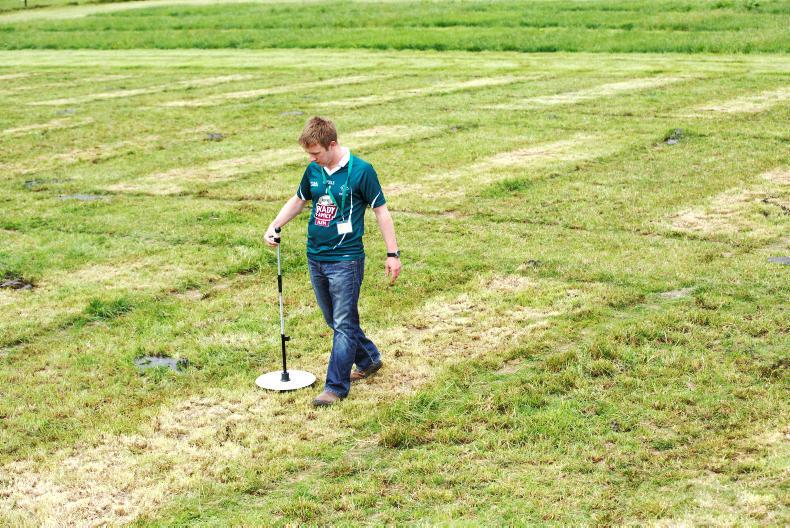
Plots were grazed when pre-grazing yield was predicted to be 1,400kgDM per ha. Prior to grazing, the following measurements were taken: pre-grazing yield, nutritive quality, sward structure (measure of leaf and stem proportions) and pre-grazing sward height (PreGSH) measured with a rising plate meter. Cows then grazed the plots and were removed when average PostGSH was visually assessed at 4cm. PostGSH were taken on each plot using a rising plate meter. The results are displayed in Figure 1.
Residual Grazed Height
At each grazing event, the achieved PostGSH was measured with a rising plate meter. However, to make better use of this concept and to accurately assess grazing efficiency, the PostGSH of each variety was predicted accounting for pre-grazing sward height, grazing interval and year.
Residual grazed height (RGH) is a measure of varietal grazing efficiency. The achieved PostGSH minus the predicted PostGSH gives us the RGH figure.
For example, the achieved PostGSH of a variety is 3.85cm and the predicted PostGSH of the same variety is 4cm. RGH is calculated by: 3.85cm – 4cm = -0.15. Where achieved PostGSH is less than the predicted PostGSH the resulting RGH value is negative which indicates good grazing efficiency.
Grazing yield
A sub-section of each plot was cut to a height of 3.5cm to assess herbage yield. Plots were grazed to different Post GSH and therefore residual DM differences occurred. To accurately account for varietal herbage growth differences, the post-grazing residual within each plot from the previous grazing event was calculated. For example, the PostGSH of a plot is 4.2cm. This is 0.7cm higher than the cutting height (4.2 – 3.5 = 0.7cm). This figure was multiplied by the herbage density calculated for that plot (eg herbage density = 205kg DM/cm). Residual dry matter = 0.7cm × 205kg DM/cm = 143.5kg DM/ha.
This figure is then subtracted from the herbage yield of the plot in the following rotation, therefore avoiding double counting of herbage grown by the sward. The cumulative mean annual yield is expressed on the vertical axis on Figure 1.
Grazing efficiency
Both herbage yield and grazing efficiency are traits of importance within variety selection for farmers. The objective is to grow as much grass as possible and graze out paddocks efficiently. Varieties with high grazing yield and negative RGH are most appropriate for grazing. The range on RGH is 0.7cm between the lowest and highest values. Those varieties on the positive extremes (right side) of this range are more difficult to graze out and will require mechanical correction. There was no topping in this study over the two years. This data will feed into the Pasture Profit Index in the years ahead as a grazing trait.
Summary
Varieties with negative RGH (towards the left hand side of Figure 1) are indicative of varieties with high grazing efficiency.
Varieties with positive RGH values (towards the right hand side of the graph) are indicative of varieties with low grazing efficiency and may require mechanical correction at stages of the grazing season.
Tetraploids tend to be better grazed than diploids over the grazing season. Some tetraploids tended to be overgrazed which impacted on their herbage DM yield.
Figure 2 shows data collected over two years. It clearly shows that cows grazing varieties with higher levels of organic matter digestibility (OMD) in the sward achieved lower PostGSH.

Tetraploids are shown to have higher levels of OMD than diploids and therefore they have lower PostGSH.
Variety Live Leaf content:
Figure 3 shows that cows grazing varieties with higher levels of leaf can achieve lower PostGSH.
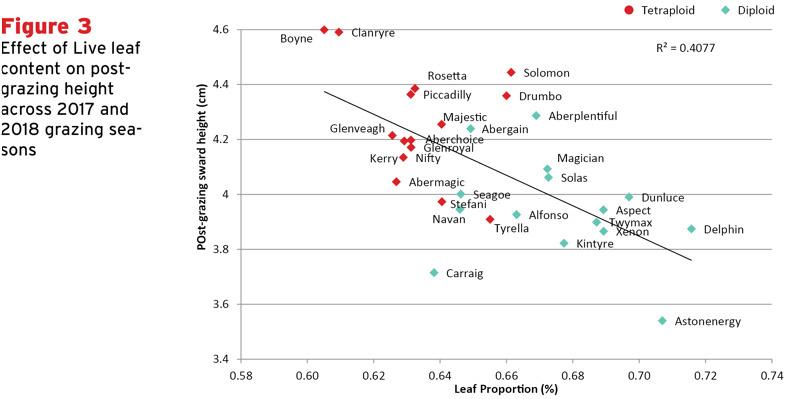
Tetraploids are shown to have higher proportion of leaf than diploids and therefore they have lower PostGSH.


SHARING OPTIONS