The first analysis of the financial performance of organic sheep farms shows such farms generated in excess of €44,000 in family farm income (FFI) in 2024.
The preliminary analysis was presented by Kevin Kilcline, Teagasc Research Economist in the Ag Economics and Farm Surveys Department at the Growing Prospects for Organic Livestock roadshow held last week in Portlaoise and this week in Ballinasloe.
The analysis has been carried out as part of the GROFarmS Growing Resilient Organic Systems project.
The collaborative, strategic investment in organic farming research is being carried out by Teagasc, UCD and the Department of Agriculture, Food and the Marine. There are three main objectives of the initiative as follows:
Analyse the economic and environmental impact of organic beef/sheep systems.Develop blueprints for sustainable organic grass-based beef/sheep systems.Include organic farms in Teagasc National Farm Survey. 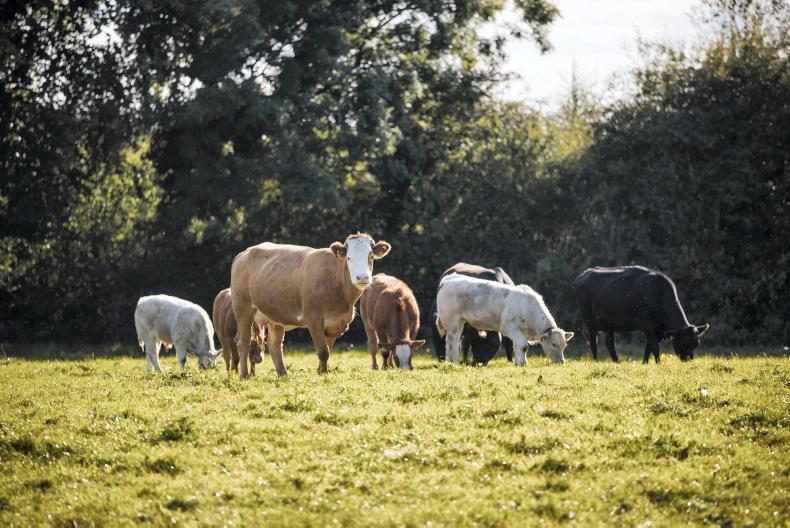
\ Claire Nash
An overarching objective is to reduce the volume of leakage from organic systems – ie reduce the number of animals born on organic farms but finished in conventional systems.
Sheep finishing and systems trials are being carried out in Teagasc Mellows Campus, Athenry while beef production systems are being put to the test in trials in Teagasc Grange and Kildavin.
Survey results
Kevin explains that the financial performance analysis completed for 2024 includes 84 farms which have joined the sample for 2024. The aim is to increase this to 100 farms in 2025.
Table 1 details family farm income for 2024 by system. Lowland sheep farms generated the highest FFI of €45,785. The table also details FFI on a per hectare basis and on a livestock unit basis.
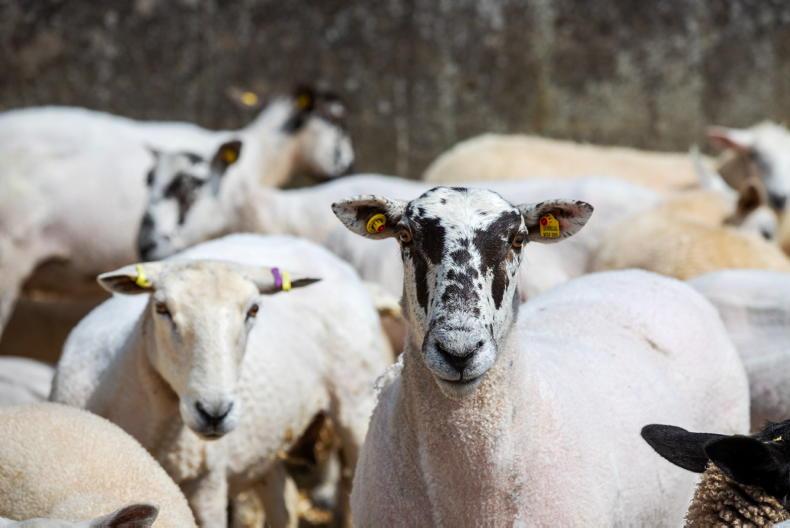
Teagasc organics specialist Elaine Leavy presented data which shows there are 142,027 hill and lowland ewes farmed under full organic status in 2025. This will increase by 42,340 to reach 183,367.
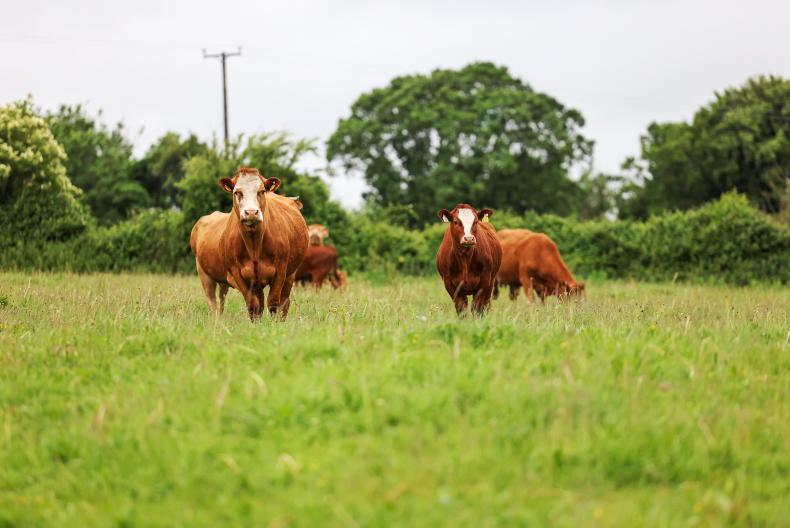
Cattle rearing farms which include farms bringing cattle through to beef generated a FFI of €36,825 while cattle rearing farms which are suckler farms generated a FFI of €19,653.
There are currently 31,487 suckler cows on organic farms and this will increase to 35,942 head on 1 January as more farms end their conversion phase and enter full organic status.
Direct costs
Table 2 details costs by organic farming system on a per-farm basis, per-hectare basis and a euro per-livestock unit basis. Costs were highest on ‘cattle other farms’ at €25,649 followed by lowland sheep farms.
This is not surprising given these farms are finishing progeny and are subject to higher concentrate costs.
Costs are lower on cattle rearing farms as these are typically more extensive systems where direct costs are significantly lower.
Table 3 details direct payments by organic system.
The critical role of organic payments in generating farm income is clearly outlined in Table 3.
Sheep farms had the highest payment of €15,097 underpinned by their larger farm size of 76ha. This was followed by lowland sheep farms and cattle farms while suckler farmers had the lowest overall payment.
Higher percentage
However, the organic payment comprised the highest percentage of overall direct payments on suckler farms accounting for 35% of direct payments.
The payment was higher on suckler farms than the total pillar 1 payments which includes the Basic Income Support for Sustainability (BISS), the Complementary Redistributive Income Support for Sustainability (CRISS) and the Eco Scheme.
When you compare the analysis in Table 1 and Table 3 it shows that suckler farms are dipping most in to direct payments to keep their farming system
in operation.
Cattle other farms dipped in to direct payments to the tune of over €3,000 while sheep farms also used a small percentage of their direct payments to sustain their farming enterprise.
This fact is not surprising given the lower stocking rate and output on many farms.
There is a word of caution in the analysis, as is the case with all NFS analysis as there is significant variance between the top performing and poorest performing enterprises.
The first analysis of the financial performance of organic sheep farms shows such farms generated in excess of €44,000 in family farm income (FFI) in 2024.
The preliminary analysis was presented by Kevin Kilcline, Teagasc Research Economist in the Ag Economics and Farm Surveys Department at the Growing Prospects for Organic Livestock roadshow held last week in Portlaoise and this week in Ballinasloe.
The analysis has been carried out as part of the GROFarmS Growing Resilient Organic Systems project.
The collaborative, strategic investment in organic farming research is being carried out by Teagasc, UCD and the Department of Agriculture, Food and the Marine. There are three main objectives of the initiative as follows:
Analyse the economic and environmental impact of organic beef/sheep systems.Develop blueprints for sustainable organic grass-based beef/sheep systems.Include organic farms in Teagasc National Farm Survey.
\ Claire Nash
An overarching objective is to reduce the volume of leakage from organic systems – ie reduce the number of animals born on organic farms but finished in conventional systems.
Sheep finishing and systems trials are being carried out in Teagasc Mellows Campus, Athenry while beef production systems are being put to the test in trials in Teagasc Grange and Kildavin.
Survey results
Kevin explains that the financial performance analysis completed for 2024 includes 84 farms which have joined the sample for 2024. The aim is to increase this to 100 farms in 2025.
Table 1 details family farm income for 2024 by system. Lowland sheep farms generated the highest FFI of €45,785. The table also details FFI on a per hectare basis and on a livestock unit basis.
Teagasc organics specialist Elaine Leavy presented data which shows there are 142,027 hill and lowland ewes farmed under full organic status in 2025. This will increase by 42,340 to reach 183,367.
Cattle rearing farms which include farms bringing cattle through to beef generated a FFI of €36,825 while cattle rearing farms which are suckler farms generated a FFI of €19,653.
There are currently 31,487 suckler cows on organic farms and this will increase to 35,942 head on 1 January as more farms end their conversion phase and enter full organic status.
Direct costs
Table 2 details costs by organic farming system on a per-farm basis, per-hectare basis and a euro per-livestock unit basis. Costs were highest on ‘cattle other farms’ at €25,649 followed by lowland sheep farms.
This is not surprising given these farms are finishing progeny and are subject to higher concentrate costs.
Costs are lower on cattle rearing farms as these are typically more extensive systems where direct costs are significantly lower.
Table 3 details direct payments by organic system.
The critical role of organic payments in generating farm income is clearly outlined in Table 3.
Sheep farms had the highest payment of €15,097 underpinned by their larger farm size of 76ha. This was followed by lowland sheep farms and cattle farms while suckler farmers had the lowest overall payment.
Higher percentage
However, the organic payment comprised the highest percentage of overall direct payments on suckler farms accounting for 35% of direct payments.
The payment was higher on suckler farms than the total pillar 1 payments which includes the Basic Income Support for Sustainability (BISS), the Complementary Redistributive Income Support for Sustainability (CRISS) and the Eco Scheme.
When you compare the analysis in Table 1 and Table 3 it shows that suckler farms are dipping most in to direct payments to keep their farming system
in operation.
Cattle other farms dipped in to direct payments to the tune of over €3,000 while sheep farms also used a small percentage of their direct payments to sustain their farming enterprise.
This fact is not surprising given the lower stocking rate and output on many farms.
There is a word of caution in the analysis, as is the case with all NFS analysis as there is significant variance between the top performing and poorest performing enterprises.


SHARING OPTIONS