

The Teagasc Agricultural Catchments Programme (ACP) was established in 2009 to evaluate the environmental and economic effectiveness of the nitrates regulations in catchments that represented the main land type and agricultural production systems with medium to high intensities.
Changes in P management in the context of soil P, P usage, P off-takes and P balances at field scale were examined between 2010 and 2014 in two catchments of mixed land-use.

Soil P trends
The Castledockerell catchment was first sampled in 2009 and this was repeated in 2013. Over this four-year period the percentage area of index 4 soils (higher risk for P loss to water) reduced from 17% to 13% but agronomic optimum (P index 3) also declined from 23% to 20% with a subsequent increase in the combined area of sub-optimal P index 2 and 1 soils from 60% to 67%.
In contrast, between 2010 and 2014 in Dunleer, the area of index 4 fields increased from 22% to 26%, with P index 3 and 2 remaining relatively constant at 17% and 34%, respectively, and the area of index 1 soils decreased from 28% to 23%.
With more than 57% of soils in both catchments at sub-optimal level, these trends are in line with national soil fertility levels. This poses a threat to production potential on farms.
These trends also highlight an ongoing issue with poor nutrient distribution within and between farms and more effort is needed to redirect away P from index 4 fields on to sub-optimal areas at farm and catchment scales.
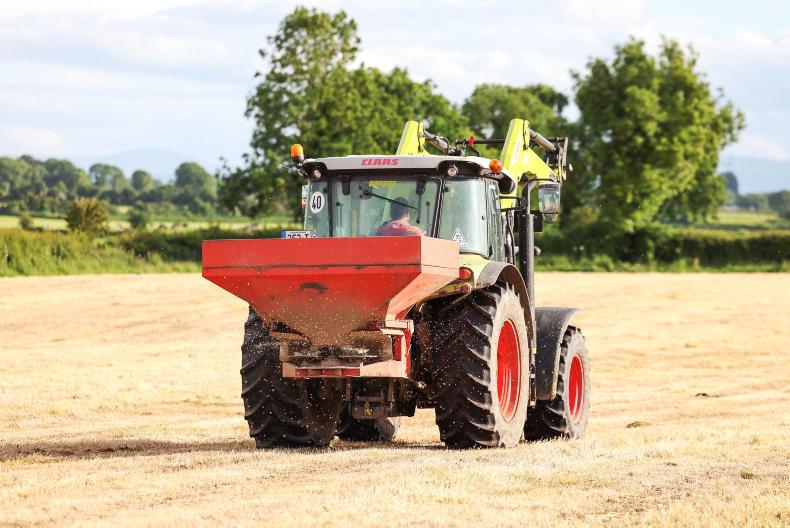
Fertiliser P usage
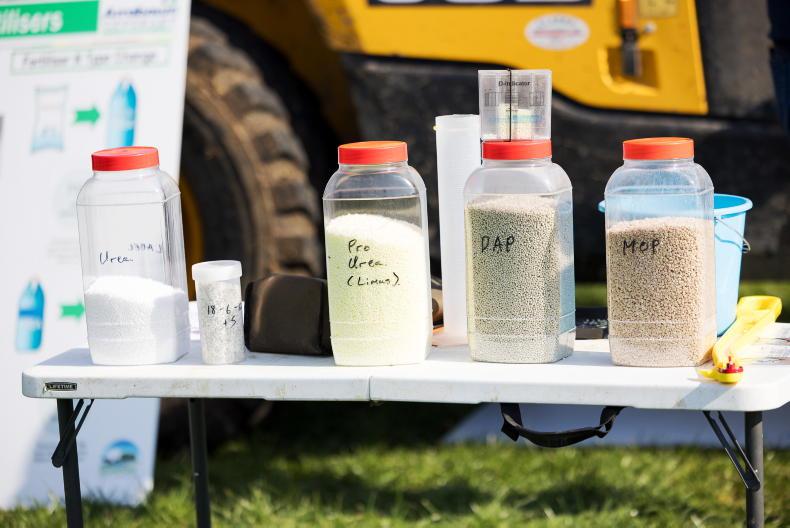
Fertilisers (mineral and organic) accounted for the main P inputs to soils in both catchments. In Castledockerell, mineral P was the main form of P applied (ie 87% of the total), of which 53% was applied in the compound mixture (N-P-K) 10-10-20. Small levels of P were obtained from applications of farmyard manure (FYM), pig and cattle slurry.
In Dunleer, 69% of P inputs were from cattle slurry, FYM and some imports of poultry manure and spent mushroom compost. Of the P applied in the mineral form, most was from 10-5-25 and 10-10-20.
As presented in Table 1, in Castledockerell, the average yearly total fertiliser P (mineral and organic) applied to fields increased from 25kg to 32kg/ha/yr between 2010 and 2013. In comparison, the average total P fertiliser inputs in Dunleer fields increased from 23kg to 39kg/ha/yr over the same four-year period. The increasing trend of P inputs in both catchments is reflective of some farmers responding to low baseline soil P levels and the need to sustain and increase crop yields and grassland production, especially with new and expanding dairy farms in Dunleer during this period.
Phosphorus off-take and balances at field scale
As shown in Table 1, the average P off-takes of crops from both catchments remained relatively similar from 2010 to 2013 (23.9kg P/ha/yr) with the exception of 2012 where yields suffered as a result of very high rainfall. Phosphorus input or removal by grazing livestock within a field was accounted for as the change (decrease/increase) in stocking rate from the previous year (2010 was used as the base year for these calculations).
As expected, due to generally low livestock numbers, P input from livestock in Castledockerell was low, but in Dunleer the average input of P from grazing livestock increased over this period as some farmers prepared for post-milk quota production in 2015.
The field P balances were calculated by subtracting the total P off-takes from the total P inputs for each field in each year. The optimal soil P balances were calculated by subtracting the total P off-takes plus the soil P buildup requirement (20kg/ha for index 1 and 10 kg/ha for index 2) from the total P inputs for each field.
When the field and soil P balances for the main crop types across both catchments were calculated, the largest average field P balance and soil P balance 73.3 kg/ha/yr and 59.7 kg/ha/yr respectively, were for fields with maize crops.

The lowest average field and soil P balances of -14.6kg/ha/yr -43.1 kg/ha/yr, respectively, were on fields used solely for grass silage production. In general, high value and short duration crops such as maize and root crops had higher P inputs as they require rapid root and tuber development once germinated.
Overall, these results show that crop type can have a large effect on the levels of P applied, retained, removed and recycled to the soil.
However, while average values for each crop type are shown, there was often large variability in P management within crop types.
Implications for water quality
The concentrations of P in the form of total reactive P (TRP) and total P (TP), discharged at the outlet of each catchment have been monitored at a sub-hourly basis since 2010.

These water quality measurements indicate that relatively low levels of P are entering the Castledockerell stream from fields and that, in general, the P management on these fields may not be an issue for water quality.
In contrast, the Dunleer stream had consistently high levels of P, suggesting that some areas of P management still need to be addressed through better nutrient management practices on these more poorly drained soils.


SHARING OPTIONS