Last week’s National Tillage Conference focused strongly on nitrogen rates and field variability. While many of the messages did not appear to be new, an increased understanding of the variability of N response increases our capacity to respond to field variation with the help of precision farming technologies.
The morning session dealt mainly with the challenges that in-field variability poses for input recommendations, while helping to show the range of benefits that might accrue from variable input control through precision farming technologies.
In Summary
There is considerable variability within fields and between years and this increases the challenge of making single recommendations for inputs like nitrogen. A new trials system, using a chessboard design, shows the natural variability across full fields and measures the responsiveness to applied N rates in different parts of that field. The response to applied N varies between sites, years and seasons, and is highly influenced by the actual (but unpredictable) release of N from the soil. In malting barley, the optimum N rate must produce optimum yield as well as protein within the required specifications. The new tillage BETTER Farms programme will focus on variability within fields and will examine the potential of precision agriculture to help optimise input and output. Chessboard research
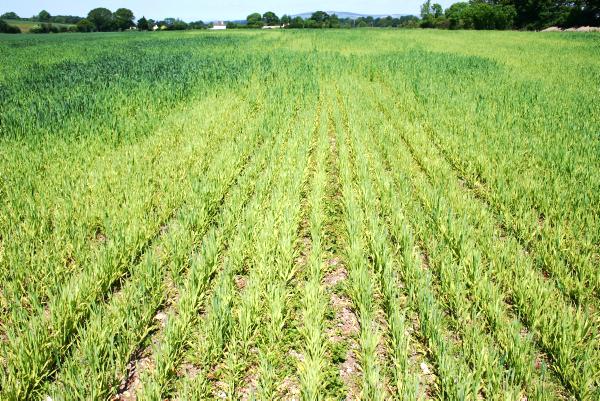
Assessing the most appropriate single nitrogen rate for any crop is a difficult task, and arguably an impossible one, according to Dan Kindred of ADAS. If crop demand is the actual yield achieved multiplied by its nitrogen percentage, then the nitrogen requirement varies throughout the field, as does yield. Tillage farmers know this very well.
The optimum nitrogen rate is extremely variable between sites and years. Dan presented a series of nitrogen response curves, which came from a range of nitrogen rate trial sites on winter wheat across Britain.
These curves had a range of shapes and slopes with very variable optimums between sites. The optimum N rate varied massively from site to site, leaving it very difficult to be able to make recommendations based on the scatter of the results.
One of the main reasons for this is because every site also receives a portion of its total N from the reserves in the soil. When the soil supply is added to show the total supply at each site, the response curves become much tighter. Using this information, the total demand at any potential yield level must be met by the amount supplied from the soil plus the amount applied as fertilizer nitrogen, minus any losses. And while the response levels can still vary considerably, Dan said that any rate recommendation must be within 50 kgN/ha of the mean optimum rate to minimise economic loss.
Variation in nitrogen requirements occurs:
Within fieldsBetween fieldsBetween farmsBetween regions Between seasons. A range of recommendation tools have been developed to help guide the optimum rate in different circumstances. One new research technique has been developed which uses a chessboard design for full field-scale trials. Normally trial sites use a small uniform plot to minimise site variation but the full field is a more variable entity. So how satisfactory is an optimum N rate for the whole field?
The chessboard trial uses the whole field to test N rates compared with an adjoining plot that received no applied nitrogen. The zero N treatments show the inherent field variability. The yields from the plots that received no applied nitrogen give the background yield potential, while the N-treated plots give the response to N in the different parts of the field. The plots are 10m by 10m in size and the fact that there are regularly placed zero N plots leaves the area looking like a chessboard.
The first of these chessboard experiments was conducted on a 5ha plot of winter wheat in a bigger field in 2010. Four N rates were applied – 0, 120, 240 and 360 kgN/ha. The results showed a big variation in the optimum level of N found in different parts of the plot and actual N-optimum yields ranged from 8.2 to 11.5 t/ha. The zero N sites ranged from above four to under 10 t/ha and this equated to a soil N supply of between 60 kgN/ha and 175 kgN/ha.
In this experiment, the highest treated yields came from the areas where the soil N supply was highest. This reiterates the fact that natural soil fertility is a better way to generate yield potential than through applied N. But because the highest yields came from the higher soil fertility areas, the efficiency of applied N use tended to be lowest where grain yields were highest and highest where soil N supply was lowest.
In the following years, further chessboard trials were carried out in full-field situations. These again showed considerable variation in the optimum N rates in the different parts of each field. In the original 5ha experiment, the difference between the highest and lowest optimum N rate was 170 kgN/ha. In the subsequent experiments, this optimum N rate variation ranged from just over 12 kg/ha at one site to over 260 kgN/ha at another site. And the yield variation from these different optimum-N rates within a field ranged from 2.0 t/ha to 4.5 t/ha. In all instances, the yield levels appear to be highly correlated to soil N availability.
Moving from British winter wheat to Irish spring barley sites, Richie Hackett of Teagasc showed that similar site variation existed within a range of trials used to produce N response curves for spring malting barley.
Sites differ considerably in the shape and starting point of the response curve. The zero N yields from standard trials varied from about 2.2 to 4.0 t/ha and the optimum rates found across sites and years ranged from just over 100 kgN/ha to almost 250 kgN/ha. Optimum N rates even varied on the same site over the three years, depending on the seasonal climate. However, the majority of the optimum rates occurred in the 150-160 kgN/ha range.
Despite the variation between sites, Richie’s work found a reasonable relationship between N rate and yield and found that an additional 25 kgN/ha resulted in an additional one tonne per hectare of yield. And, just as Dan had stated, the optimum N rates tended to be lower where the yield without N was higher.
These trials verified the N rate for yield, but problems securing protein within spec in recent years provide an additional dilemma around the optimum rate for the combined requirement of yield and protein.
In the same series of trials, the protein content ranged from 7.5% to 13% protein at 150 kgN/ha. This obvious considerable variation is challenging for growers and advisers, who need to hit the optimum yield within the protein specifications and do that every year.
Richie explained that the N supply from the soil is a major factor in altering the total crop response to N, especially the applied N. He also explained that a given amount of N has a relationship to grain N, but that it is impacted by grain yield.
He gave a simple example of a crop which had 107 kgN/ha in the grain, with a yield of 7.5 t/ha producing grain with 10.5% protein. If the N present in the grain increased to 118 kgN/ha (as a result of soil released N or higher application rate), the same grain yield would have 11.6% protein. But if the yield increased to 8.25 t/ha, with 107 kgN/ha gone to the grain, then the protein would be 9.5%.
The problem is that these variables are very difficult to control and variability is a consequence. Newer tools are being developed to try to sharpen the grower’s control over these variables, but variability remains. Factors like drought and variable soil temperatures and moisture levels affect the timing of the release of soil N and so directly impact on either yield or protein. Increasingly worn or compressed soils add further to the challenges of hitting these targets, as does failure to control disease.
Acting on variability
In-field variability was also dealt with by Dermot Forristal. Dermot spoke about Teagasc’s intention to look more at in-field variation in the new BETTER Farms programme and to examine practical ways to tackle this variability with the help of precision farming techniques.
The presence of in-field variability is beyond doubt and precision or GPS control tools have long been heralded as having huge potential in agriculture to help combat this. But while offering potential to be more precise, the concept of site-specific farming is still lacking at farm level.
The challenge remains to identify the main causes of yield variation and to identify the appropriate response. This needs research.
The ‘cause and response’ is the most challenging aspect of precision agriculture. Indeed, many of the delivery tools such as variable seed, fertilizer and spray rates are in place before the most appropriate response has been identified. And the most appropriate response may vary between large extensive farms and those striving to optimise output from a small acreage. The challenge for researchers is to identify the most appropriate response.
While GPS systems do offer improved machine guidance and control systems to minimise waste, it will be much more difficult to develop the information systems to guide better site-specific decisions. Indeed, Dermot stated that this task will require collaboration between Teagasc and other research institutions.
That said, Teagasc will initiate a precision agriculture approach in the new BETTER Farm programme. The aim is to select farms with an interest in the technology and perhaps some who already have some precision farming capacity.
The initial task will be to quantify the in-field variation and hopefully find the causes. Yield mapping will play a role but the development of data analysis systems will be crucial.
Part of the work will involve replicated trials where some of the causes of variation are known, with ‘high’ and ‘low’ response treatments tested in grids within a field. It is also intended to test satellite-sensing techniques and also handheld or tractor-mounted reflectance technologies which can be used to alter input intensity.
The big challenge for this research is to identify the correct response to the main causes of variability. Then the benefits need to be quantified relative to the equipment costs. While we are unlikely to see massive benefits from this work in the short term, some special management tools are likely to emerge as a result.
Farms wanted
Teagasc is actively inviting farmers with a willingness to participate in the new BETTER Farms programme to contact them directly. They wish to work with a number of different farmers who are willing to co-operate re the potential of precision farming.
Last week’s National Tillage Conference focused strongly on nitrogen rates and field variability. While many of the messages did not appear to be new, an increased understanding of the variability of N response increases our capacity to respond to field variation with the help of precision farming technologies.
The morning session dealt mainly with the challenges that in-field variability poses for input recommendations, while helping to show the range of benefits that might accrue from variable input control through precision farming technologies.
In Summary
There is considerable variability within fields and between years and this increases the challenge of making single recommendations for inputs like nitrogen. A new trials system, using a chessboard design, shows the natural variability across full fields and measures the responsiveness to applied N rates in different parts of that field. The response to applied N varies between sites, years and seasons, and is highly influenced by the actual (but unpredictable) release of N from the soil. In malting barley, the optimum N rate must produce optimum yield as well as protein within the required specifications. The new tillage BETTER Farms programme will focus on variability within fields and will examine the potential of precision agriculture to help optimise input and output. Chessboard research
Assessing the most appropriate single nitrogen rate for any crop is a difficult task, and arguably an impossible one, according to Dan Kindred of ADAS. If crop demand is the actual yield achieved multiplied by its nitrogen percentage, then the nitrogen requirement varies throughout the field, as does yield. Tillage farmers know this very well.
The optimum nitrogen rate is extremely variable between sites and years. Dan presented a series of nitrogen response curves, which came from a range of nitrogen rate trial sites on winter wheat across Britain.
These curves had a range of shapes and slopes with very variable optimums between sites. The optimum N rate varied massively from site to site, leaving it very difficult to be able to make recommendations based on the scatter of the results.
One of the main reasons for this is because every site also receives a portion of its total N from the reserves in the soil. When the soil supply is added to show the total supply at each site, the response curves become much tighter. Using this information, the total demand at any potential yield level must be met by the amount supplied from the soil plus the amount applied as fertilizer nitrogen, minus any losses. And while the response levels can still vary considerably, Dan said that any rate recommendation must be within 50 kgN/ha of the mean optimum rate to minimise economic loss.
Variation in nitrogen requirements occurs:
Within fieldsBetween fieldsBetween farmsBetween regions Between seasons. A range of recommendation tools have been developed to help guide the optimum rate in different circumstances. One new research technique has been developed which uses a chessboard design for full field-scale trials. Normally trial sites use a small uniform plot to minimise site variation but the full field is a more variable entity. So how satisfactory is an optimum N rate for the whole field?
The chessboard trial uses the whole field to test N rates compared with an adjoining plot that received no applied nitrogen. The zero N treatments show the inherent field variability. The yields from the plots that received no applied nitrogen give the background yield potential, while the N-treated plots give the response to N in the different parts of the field. The plots are 10m by 10m in size and the fact that there are regularly placed zero N plots leaves the area looking like a chessboard.
The first of these chessboard experiments was conducted on a 5ha plot of winter wheat in a bigger field in 2010. Four N rates were applied – 0, 120, 240 and 360 kgN/ha. The results showed a big variation in the optimum level of N found in different parts of the plot and actual N-optimum yields ranged from 8.2 to 11.5 t/ha. The zero N sites ranged from above four to under 10 t/ha and this equated to a soil N supply of between 60 kgN/ha and 175 kgN/ha.
In this experiment, the highest treated yields came from the areas where the soil N supply was highest. This reiterates the fact that natural soil fertility is a better way to generate yield potential than through applied N. But because the highest yields came from the higher soil fertility areas, the efficiency of applied N use tended to be lowest where grain yields were highest and highest where soil N supply was lowest.
In the following years, further chessboard trials were carried out in full-field situations. These again showed considerable variation in the optimum N rates in the different parts of each field. In the original 5ha experiment, the difference between the highest and lowest optimum N rate was 170 kgN/ha. In the subsequent experiments, this optimum N rate variation ranged from just over 12 kg/ha at one site to over 260 kgN/ha at another site. And the yield variation from these different optimum-N rates within a field ranged from 2.0 t/ha to 4.5 t/ha. In all instances, the yield levels appear to be highly correlated to soil N availability.
Moving from British winter wheat to Irish spring barley sites, Richie Hackett of Teagasc showed that similar site variation existed within a range of trials used to produce N response curves for spring malting barley.
Sites differ considerably in the shape and starting point of the response curve. The zero N yields from standard trials varied from about 2.2 to 4.0 t/ha and the optimum rates found across sites and years ranged from just over 100 kgN/ha to almost 250 kgN/ha. Optimum N rates even varied on the same site over the three years, depending on the seasonal climate. However, the majority of the optimum rates occurred in the 150-160 kgN/ha range.
Despite the variation between sites, Richie’s work found a reasonable relationship between N rate and yield and found that an additional 25 kgN/ha resulted in an additional one tonne per hectare of yield. And, just as Dan had stated, the optimum N rates tended to be lower where the yield without N was higher.
These trials verified the N rate for yield, but problems securing protein within spec in recent years provide an additional dilemma around the optimum rate for the combined requirement of yield and protein.
In the same series of trials, the protein content ranged from 7.5% to 13% protein at 150 kgN/ha. This obvious considerable variation is challenging for growers and advisers, who need to hit the optimum yield within the protein specifications and do that every year.
Richie explained that the N supply from the soil is a major factor in altering the total crop response to N, especially the applied N. He also explained that a given amount of N has a relationship to grain N, but that it is impacted by grain yield.
He gave a simple example of a crop which had 107 kgN/ha in the grain, with a yield of 7.5 t/ha producing grain with 10.5% protein. If the N present in the grain increased to 118 kgN/ha (as a result of soil released N or higher application rate), the same grain yield would have 11.6% protein. But if the yield increased to 8.25 t/ha, with 107 kgN/ha gone to the grain, then the protein would be 9.5%.
The problem is that these variables are very difficult to control and variability is a consequence. Newer tools are being developed to try to sharpen the grower’s control over these variables, but variability remains. Factors like drought and variable soil temperatures and moisture levels affect the timing of the release of soil N and so directly impact on either yield or protein. Increasingly worn or compressed soils add further to the challenges of hitting these targets, as does failure to control disease.
Acting on variability
In-field variability was also dealt with by Dermot Forristal. Dermot spoke about Teagasc’s intention to look more at in-field variation in the new BETTER Farms programme and to examine practical ways to tackle this variability with the help of precision farming techniques.
The presence of in-field variability is beyond doubt and precision or GPS control tools have long been heralded as having huge potential in agriculture to help combat this. But while offering potential to be more precise, the concept of site-specific farming is still lacking at farm level.
The challenge remains to identify the main causes of yield variation and to identify the appropriate response. This needs research.
The ‘cause and response’ is the most challenging aspect of precision agriculture. Indeed, many of the delivery tools such as variable seed, fertilizer and spray rates are in place before the most appropriate response has been identified. And the most appropriate response may vary between large extensive farms and those striving to optimise output from a small acreage. The challenge for researchers is to identify the most appropriate response.
While GPS systems do offer improved machine guidance and control systems to minimise waste, it will be much more difficult to develop the information systems to guide better site-specific decisions. Indeed, Dermot stated that this task will require collaboration between Teagasc and other research institutions.
That said, Teagasc will initiate a precision agriculture approach in the new BETTER Farm programme. The aim is to select farms with an interest in the technology and perhaps some who already have some precision farming capacity.
The initial task will be to quantify the in-field variation and hopefully find the causes. Yield mapping will play a role but the development of data analysis systems will be crucial.
Part of the work will involve replicated trials where some of the causes of variation are known, with ‘high’ and ‘low’ response treatments tested in grids within a field. It is also intended to test satellite-sensing techniques and also handheld or tractor-mounted reflectance technologies which can be used to alter input intensity.
The big challenge for this research is to identify the correct response to the main causes of variability. Then the benefits need to be quantified relative to the equipment costs. While we are unlikely to see massive benefits from this work in the short term, some special management tools are likely to emerge as a result.
Farms wanted
Teagasc is actively inviting farmers with a willingness to participate in the new BETTER Farms programme to contact them directly. They wish to work with a number of different farmers who are willing to co-operate re the potential of precision farming.







SHARING OPTIONS