

Last week, I discussed preparing technical benchmarks for livestock businesses and calculating enterprise gross margins.
This week, we look at benchmarking the farm accounts to analyse how the business is performing.
One method that is commonly used is the Gross Output Analysis. This is a simple yet very effective tool to identify the areas of the business that are underperforming.
The Gross Output Analysis takes the farm profit and loss account and compares the results with standard industry figures for the particular farm type.
Table 1 demonstrates the key measures in a gross output analysis.
All the costs are calculated as a percentage of the total gross output to give a simple guide to the cost structure of the business.
Gross output
The first thing to establish is the gross output, which is the value of everything the farm business produces during the year, together with the appropriate support payments.
At year-end there may be unfinished/finished produce that has not yet been sold, therefore gross output includes the closing valuation for the year.
The opening valuation is taken off because although it will contribute to the current year’s sales, it relates to the production activity of the previous trading year.
The value of livestock purchases is also deducted.
Once the gross output has been established, the first area to look at is the whole farm gross margin.
This is the gross output less the variable costs of production. The gross margin gives an indication of the technical efficiency of the farm business.
A margin of less than 60% indicates that any efforts to improve the business should be directed at technical improvements.
Fixed costs
Next come the fixed costs. These are split into three sections: labour, power and machinery and general overheads.
As can be seen in Table 1, due to the nature of more modern farming businesses, labour and power and machinery are often combined due to the fact that they are somewhat substitutable for each other.
Should these two amount to beyond 36% of output, then it suggests that the organisation of the business requires further investigation.
Drivers of this can be poor utilisation of labour, or perhaps high depreciation costs due to being over-mechanised.
While general overheads do not make up a large proportion of the cost of doing business, shaving 1% from them can lead to significant savings for the business. For instance, a 1% saving for a farm business with a gross output of £180 000 is equivalent to £1,800.
Taking these fixed costs from the gross margin gives us the gross profit.
This should be at least 30% to allow the business to comfortably meet the rent and finance costs and deliver a sustainable net profit.
Finally, rent and finance costs should be less than 15% of the gross output of the business.
If they exceed 20%, it would suggest that either the business is over-borrowed or is paying excessive rent levels for the output generated.
On our same £180 000 gross output and 1% improvement, the £1,800 improvement is almost equivalent to selling two store steers.
If all of the sections above have fallen into place, this should leave a net profit of at least 15% of gross output.
While nobody particularly cares for paying tax, a healthy net profit is far more important. A business that consistently fails to deliver a profit does not remain a business for long.
On the focus farms this week
The focus farms have all reviewed feed stocks at the start of the new year.
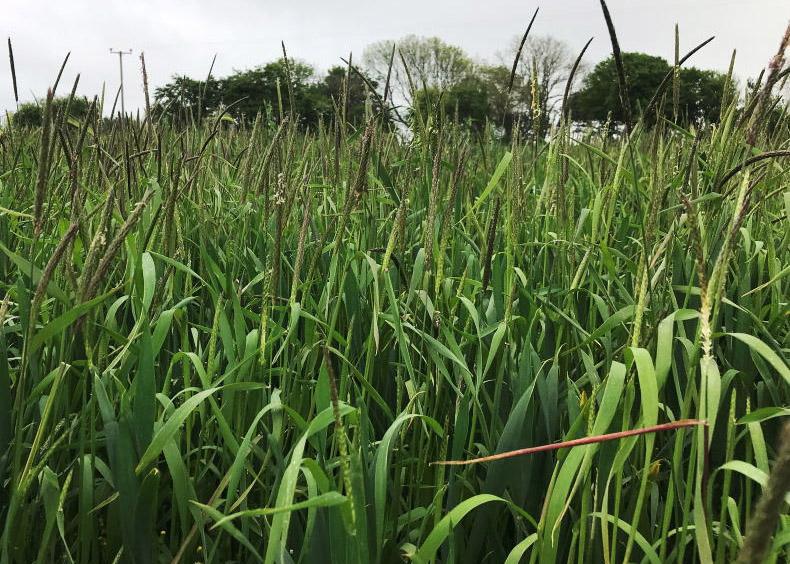
The long, dry and mild spell throughout December and into early January had some of the farms questioning an early application of nitrogen on grazing ground.
While soil temperatures were hovering around the 5°C mark, when looking at the long-term forecast a change in weather was on the cards, so many farmers decided to hold off.
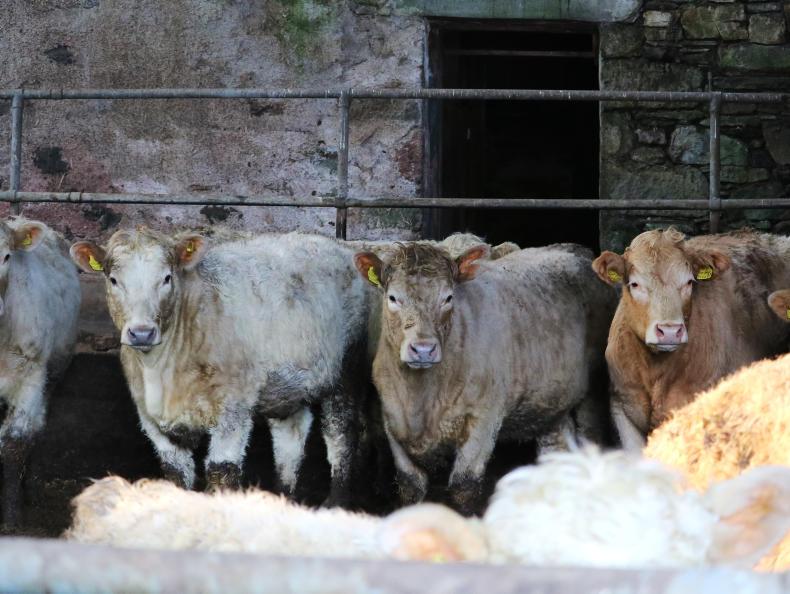
Mark Mackay in Caithness turned out 24 yearling heifers for 10 days. Silage stocks on the farm are quite tight, so with conditions favourable and plenty of grass on-farm, it was decided to get them out before the weather turns.
They were housed again after, so as not to disrupt thrive. This saved in the region of £250 in feed costs.
Sheep scanning is taking place at the moment.
The Websters will begin lambing in mid-March and scanned last week. Results were good, with an overall scanning rate of 195%.
Ewes will now be batched according to litter size and body condition, and fed appropriately.
While scanning alone is not a measure of flock performance, it is an important management tool in getting nutrition correct in the last few weeks of pregnancy.


SHARING OPTIONS