Sensors capable of measuring crop reflectance to generate normalised difference vegetation index (NDVI) maps to guide nitrogen (N) applications have been around for some time now.
The most commonly known instruments include tractor-mounted active sensors and, to a lesser extent, drone-mounted passive sensors.
The sensors are able to detect the levels of light which are being reflected from the crop and correlate this to the crop N levels. This, in turn, can help to guide crop N requirements.
However, few growers are aware that they can access up-to-date vegetation index maps specific to their land for free.
Sentinel Hub playground
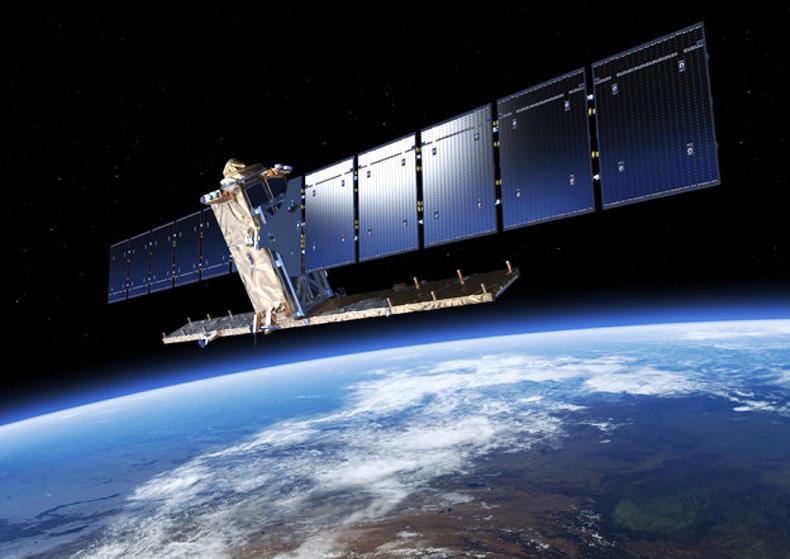
One of the sentinel satellites taking images of the earth.
The Sentinel Hub playground is an online engine for processing satellite data. It collates and processes thousands of high-resolution images taken daily by Sentinel, Landsat and other earth observation imagery and makes it easily accessible for browsing and analysis.
Depending on the satellites, they pass overhead every two to five days taking hundreds of thousands of multispectral images of the earth. The database on the Sentinel Hub playground can go back as far as 2015.
While the website offers a range of other uses which come at a charge, internet users can browse the satellite imagery free of charge.
As the satellites are multispectral, there are a number of layers to each map including natural colours, infrared, false colour and moisture index. However, the vegetation index is of most interest to us.
Areas and condition
Here, users can access up-to-date vegetation index maps quickly identifying vegetated areas and their condition. The images can detect different densities of vegetation, display variation within a field and can easily distinguish between grassland, stubble and cropped areas.
Sentinel Hub playground can be accessed here.
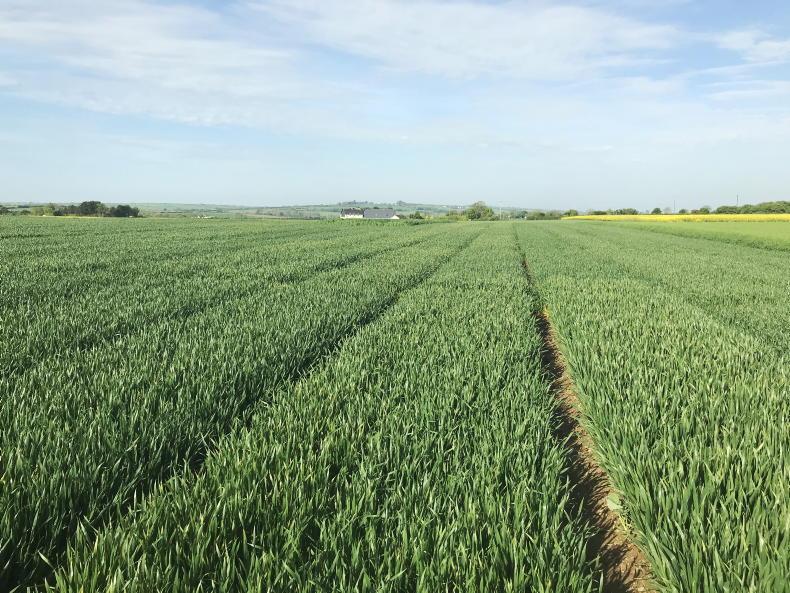
Satellite images taken last Monday

A satellite image taken this week.
Here, we have a satellite image taken from an area in Co Wexford yesterday, 18 March.
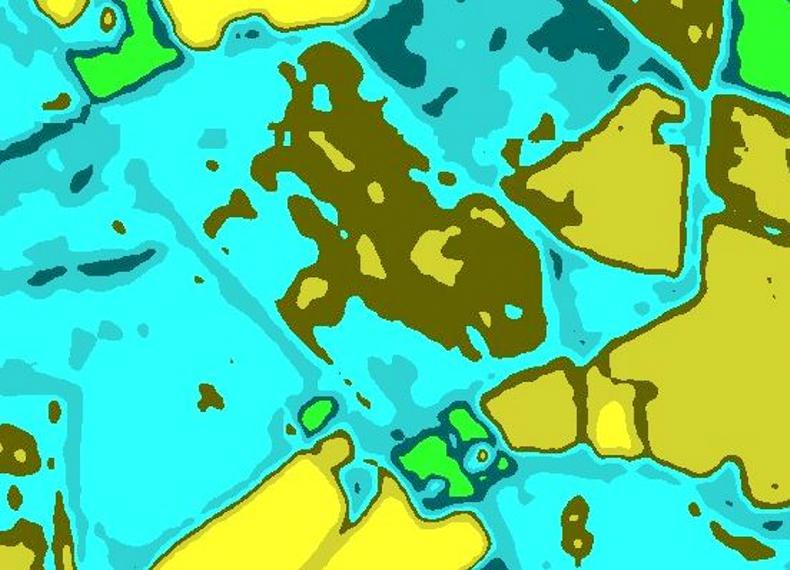
Vegetation index maps

The vegetation index map of the same satellite image.
Here, we have the vegetation index map of the same image. In this particular colour scheme, grassland is green, as are thick cereal crops. Stubble ground is yellow, while bare patches of soil are brown. Most fields of cereals, however, are blue in colour but contain variations in colour shades in each field indicating the areas of variation in crop performance.
Are these images useful?
While having free access to this data is interesting, it does not currently serve any practical use other than helping to identify variability within a field.
There are also a number of issues relating to the satellite imagery. Cloud cover can be a particular problem as the vegetation index maps can’t distinguish between clouds and land.
Furthermore, as the satellites use passive sensors which rely on sunlight, this can pose a number of issues with the readings. For example, the angle of the light coming off the sun can affect the levels of light reaching the sensor. This will have an effect on the accuracy of the readings.
A glimpse into the future?
Sentinel Hub playground does, however, serve to give us a glimpse into the future. The theory of satellites taking crop readings every number of days and presenting the data in a usable form for farmers is correct.
As satellite technology improves, this form of data collection is likely to play a much bigger role in crop and grass production.
Read more
BETTER crops update: a history of precision agriculture in Waterford
BETTER crops update: farm future proofing with the help of precision tech
Sensors capable of measuring crop reflectance to generate normalised difference vegetation index (NDVI) maps to guide nitrogen (N) applications have been around for some time now.
The most commonly known instruments include tractor-mounted active sensors and, to a lesser extent, drone-mounted passive sensors.
The sensors are able to detect the levels of light which are being reflected from the crop and correlate this to the crop N levels. This, in turn, can help to guide crop N requirements.
However, few growers are aware that they can access up-to-date vegetation index maps specific to their land for free.
Sentinel Hub playground
One of the sentinel satellites taking images of the earth.
The Sentinel Hub playground is an online engine for processing satellite data. It collates and processes thousands of high-resolution images taken daily by Sentinel, Landsat and other earth observation imagery and makes it easily accessible for browsing and analysis.
Depending on the satellites, they pass overhead every two to five days taking hundreds of thousands of multispectral images of the earth. The database on the Sentinel Hub playground can go back as far as 2015.
While the website offers a range of other uses which come at a charge, internet users can browse the satellite imagery free of charge.
As the satellites are multispectral, there are a number of layers to each map including natural colours, infrared, false colour and moisture index. However, the vegetation index is of most interest to us.
Areas and condition
Here, users can access up-to-date vegetation index maps quickly identifying vegetated areas and their condition. The images can detect different densities of vegetation, display variation within a field and can easily distinguish between grassland, stubble and cropped areas.
Sentinel Hub playground can be accessed here.
Satellite images taken last Monday
A satellite image taken this week.
Here, we have a satellite image taken from an area in Co Wexford yesterday, 18 March.
Vegetation index maps
The vegetation index map of the same satellite image.
Here, we have the vegetation index map of the same image. In this particular colour scheme, grassland is green, as are thick cereal crops. Stubble ground is yellow, while bare patches of soil are brown. Most fields of cereals, however, are blue in colour but contain variations in colour shades in each field indicating the areas of variation in crop performance.
Are these images useful?
While having free access to this data is interesting, it does not currently serve any practical use other than helping to identify variability within a field.
There are also a number of issues relating to the satellite imagery. Cloud cover can be a particular problem as the vegetation index maps can’t distinguish between clouds and land.
Furthermore, as the satellites use passive sensors which rely on sunlight, this can pose a number of issues with the readings. For example, the angle of the light coming off the sun can affect the levels of light reaching the sensor. This will have an effect on the accuracy of the readings.
A glimpse into the future?
Sentinel Hub playground does, however, serve to give us a glimpse into the future. The theory of satellites taking crop readings every number of days and presenting the data in a usable form for farmers is correct.
As satellite technology improves, this form of data collection is likely to play a much bigger role in crop and grass production.
Read more
BETTER crops update: a history of precision agriculture in Waterford
BETTER crops update: farm future proofing with the help of precision tech


SHARING OPTIONS