

This is probably one of the most common questions asked about the €uro-Star system.
ICBF has a large database which receives information about animals on a daily basis.
Data such as calving surveys, weights, carcase records and death dates are sent to ICBF from farmers, weight recorders, Department of Agriculture, marts, factories, etc.
This data is then evaluated six times per year, which results in updates to the €uro-Star index values of animals. These updates are what cause stars to change on animals.
Take a farmer who submitted weights on their cows and calves last autumn as part of the BEEP-S programme.
This weight data is used in the evaluation of a number of traits such as maternal weaning weight (milk) and cow liveweight.
Weights were submitted for 20 cows and their 20 calves. The ICBF evaluation looks at these animals as a contemporary group.
Comparison
Each cow and calf’s performance is compared to the 19 other cows and calves in the group. It is not compared with the performance of animals in a neighbour’s herd, as those animals could be managed very differently. The animals that are performing well in the group will generally see a rise in their €uro-Star figures and those performing poorly will see a drop.
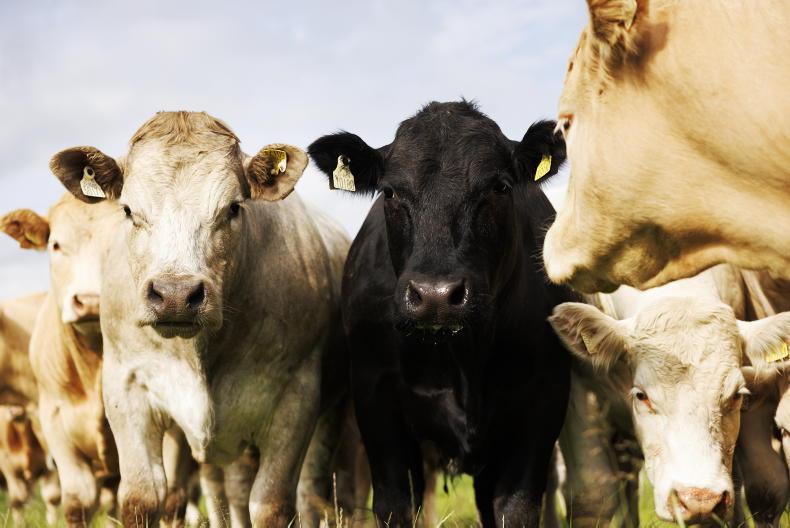
We’ll pick out two cows from the herd and look closer at their performance. Cow 289 was one of the lightest cows in the herd at 640kg, but her calf had one of the highest average daily gains (ADG) at 1.48 kg/day, giving it an adjusted 200-day weight of 341kg.
This gave a cow/calf weaning efficiency percentage of 53% (calf’s weight as a percentage of the cow’s weight).
Cow 285 was one of the heaviest cows in the herd at 775kg and her calf had one of the lowest ADGs at 1.21 kg/day, giving it a 200-day weight of 287kg. This gave a cow-calf weaning efficiency percentage of 37%.
Table 1 details the performance of both cows.
Both cows were fifth-calvers, both of their calves were male and sired by the same stock bull, so neither cow had an advantage over the other, eg one cow had a bull calf and the other a heifer calf. At the next evaluation, cow 289 will likely see an increase in her replacement index, while cow 285 will see a decrease. Cow 285 will get the benefit of a higher liveweight on carcase weight and cull cow weight though.
Table 2 details the likely direction of movement on the replacement index and the relevant traits based on the weight the data submitted.
While cow 285 will lose out on milk and cow liveweight, she will gain on the carcase weight and cull cow weight traits. Her overall replacement index will likely drop though, as milk and cow liveweight have a higher value in the index.
The index and trait values will change for an animal in most evaluations but this does not necessarily mean the stars will change. The current across-breed cut-off to gave five stars on the replacement index is €118 (see Table 3).
Using cow 285 in our example, she had a replacement index of €135. The poor weight data recorded saw this drop to €120.
Her index value will have dropped, but she would still be five-star as she is still above the €118 cut-off to be five-star. Cow 289 had a replacement index of €165 which increased to €182 based on her favourable performance.
Again, her index has changed but she remains five-star.
Index and trait values move based on the data ICBF receives on animals and they will continue to move in the future.
The Dublin footballers won six All-Irelands in a row from 2015-2020.
At their peak, they were undoubtedly the best team in the country and were ranked accordingly.
We are now in 2023 and the Dublin team’s performances have waned, while other teams have improved and are now rightly ranked ahead of Dublin.
The same principle applies to the €uro-Star indices.
ICBF will continue to evaluate and rerank animals based on the latest available data.


SHARING OPTIONS