In December, two of the Footprint Farms were surveyed by LiDAR as part of the Signpost Programme. The rest will be surveyed before the end of the year. Ellen Durkin reports.
In December, two of the Footprint Farms were surveyed by LiDAR as part of the Teagasc Signpost Programme. This is to provide a baseline measure of carbon stocks and habitats on farms, as well as point out critical source areas for pollution. In time, farmers could be rewarded for carbon storage and habitat improvement.
Background
Hedgerows are linear landscape features composed of shrubs and trees and they represent over 4% of the national land area, with a length of 689,000km, according to Teagasc.
ADVERTISEMENT
New research from Teagasc’s Farm Carbon Project shows there could be 58t C/ha stored in hedgerows, while previous work carried out in assessing the carbon sink potential indicated potential to sequester 0.5t to 2.7t CO2/ha/year.
However, direct measurements of hedgerow biomass are required to quantify carbon stock changes for national greenhouse gas reporting for the land use change and forestry sector.
Overall aim
The overall goal is to create a habitat map for all farms that are involved in the Signpost Programme. Firstly, satellite and aerial photographs were used to digitise the woody habitats on the farms. Next, the total hectarage of the habitats was calculated to find out what percentage of the farm is covered by them. Once the hectarage of habitats has been established, we can then figure out their carbon sequestration potential.
The role of LiDAR is to figure out the biomass of the habitats and from there, the carbon sequestration of the habitats on the farms can be estimated. Data collected won’t be analysed for a few months until the results of the Farm Carbon project are published.
The role of LiDAR
One of the tools being used on the farms is light-distance and ranging (LiDAR) surveys. LiDAR is a laser-scanning technology that gives an accurate 3D picture of each farm. This 3D data is used to estimate the carbon stored in hedgerows and trees as it can accurately measure their physical characteristics.
LiDAR gives accurate measurements of hedgerow volume and new equations from the Teagasc Farm-Carbon project will be used to convert the volume of hedgerow into an estimate of the carbon stored in leaves, branches and roots.
The laser scan will also allow for better, more accurate, maps of on-farm biodiversity and can be used to look at how water flows across the farm.
Why is this work being carried out?
The Teagasc Signpost farms are being surveyed by LiDAR to provide a baseline measure of carbon stocks and habitat.
This will show a baseline for seeing how effective the Teagasc Signpost Programme is in terms of improving the carbon and sustainability profile of the farms over time.
This work is important because it gives a baseline of carbon storage on farms and allows farmers to examine if their carbon storage increases over time.
If it does increase, then this means that they have helped to offset some of the emissions produced on the farm.
Costs
The LiDAR scanning that Teagasc commissioned for this project costs up to a couple of thousand euro per farm, depending on farm size and how fragmented the land is.
The bigger the farm and the more fragmented it is, the more expensive the survey is.
There are cheaper ways to estimate hedgerow volume, however they are less precise.
A national LiDAR survey that is accessible to the public, Government bodies and researchers would provide the best baseline for all farmers.
On the other hand, basic mapping and satellite imagery can cost approximately €3.50 an acre, upwards to €30 or €40.
However, this is usually for solar and energy clients. For example, for a 60ac farm requesting full LiDAR and multi-spectral imagery, along with data processing and results, this would cost in the region of €2,500 to €3,000.
Conducting the survey
Bob Foley from Engineers with Drones was tasked with carrying out the surveying on the farms.
Using a drone to carry out this work is the most economical and efficient method, and it means Bob can easily cover 550 acres in a day.
Bob Foley from Engineers With Drones. \ Odhran Ducie
He captured three different types of data while on the farm.
These were LiDAR, multi-spectral imaging and standard RGB, which is essentially a colour photo. This is to allow for photogametry, which allows a 3D view, similar to what you would see on Google Maps 3D view.
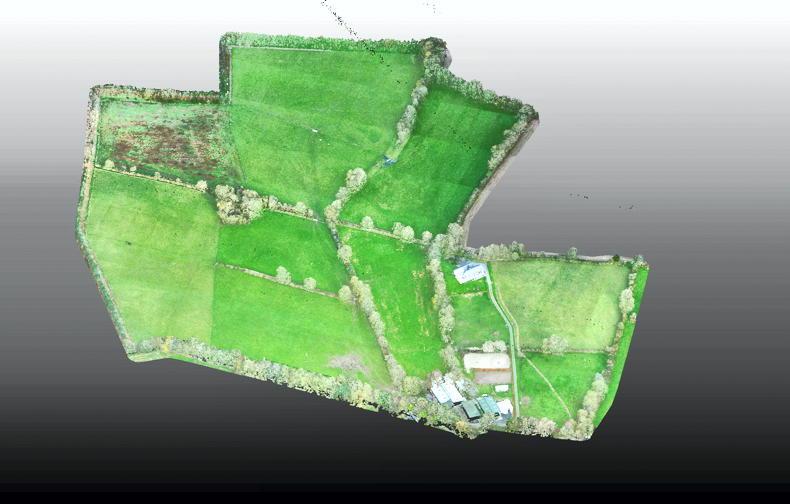
The end product of LiDAR is a point cloud. This can be analysed to generate a green earth model to see streams, trees, and in the case of forestry, it even allows for the measurement of the height of the trees.
LiDAR works by pulsing out laser beams, which return a reflection, and it gradually builds a 3D image as it spins. LiDAR can pinpoint all the gaps in vegetation.
For example, an advanced use of LiDAR might be used in a forestry setting to measure the health of trees, to see on average how much they grow, or if you’re meeting growth targets, etc.
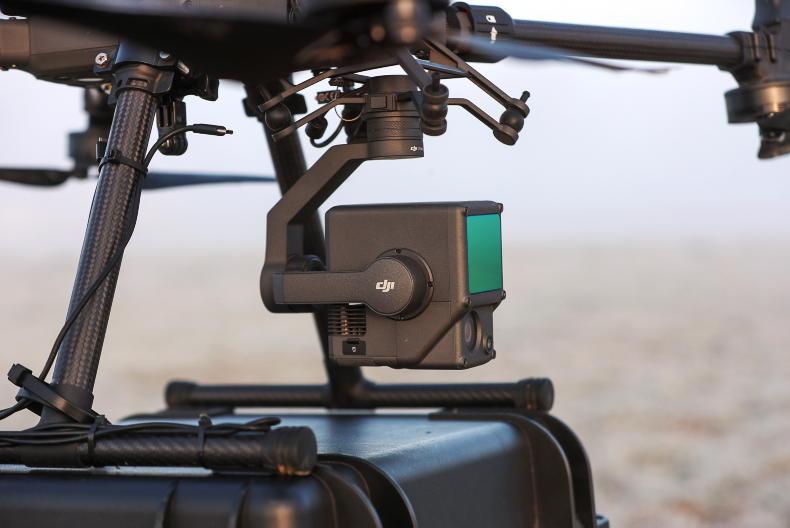
A close-up view of a LiDAR sensor on a DJI drone. \ Odhran Ducie
LiDAR can also measure ditches and hedgerows and the non-productive land on the farm to see how much vegetation exists, such as trees, bushes and hedgerows.
“LiDAR is metrically useful data, not just a pretty picture,” Bob says. “Fundamentally, you can measure how much vegetation there is, how much trees, bushes, hedgerows and see how diverse land is.”
Multi-spectral imaging was also carried out on the farms. This involves four or five cameras integrated into a single model and basically takes photos that look like what a bird would see, for example, as they see different wavelengths of light compared to humans. Using any one spectrum isn’t particularly useful, but using different spectrums and dividing them allows for the creation of indexes.
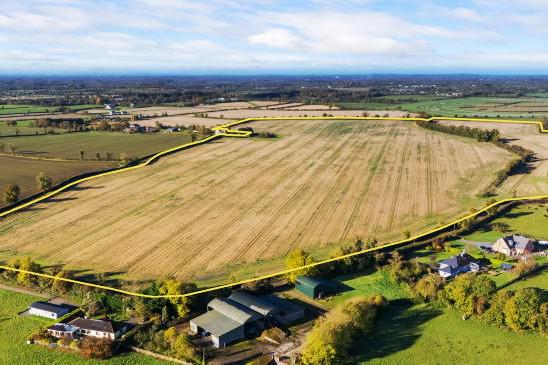
LiDAR image from Footprint Farmer Ciara Kinsella's farm
These are called NDVI and NDRE and are also known as vegetative indexes. NDRE stands for normalised difference red edge, which is a way of measuring the chlorophyll content in plants and NDVI is the dimension index, which tells you how much drought stress the plant is under.
“This data is useful because it can be used in precision agriculture systems to see which areas are under moisture stress,” explains Bob.
Register for free to read this story and our free stories.
This content is available to digital subscribers and loyalty code users only. Sign in to your account, use the code or subscribe to get unlimited access.
However, if you would like to share the information in this article, you may use the headline, summary and link below:
Title: Counting carbon and pollution with drones
In December, two of the Footprint Farms were surveyed by LiDAR as part of the Signpost Programme. The rest will be surveyed before the end of the year. Ellen Durkin reports.
The reader loyalty code gives you full access to the site from when you enter it until the following Wednesday at 9pm. Find your unique code on the back page of Irish Country Living every week.
CODE ACCEPTED
You have full access to the site until next Wednesday at 9pm.
CODE NOT VALID
Please try again or contact support.
In December, two of the Footprint Farms were surveyed by LiDAR as part of the Teagasc Signpost Programme. This is to provide a baseline measure of carbon stocks and habitats on farms, as well as point out critical source areas for pollution. In time, farmers could be rewarded for carbon storage and habitat improvement.
Background
Hedgerows are linear landscape features composed of shrubs and trees and they represent over 4% of the national land area, with a length of 689,000km, according to Teagasc.
New research from Teagasc’s Farm Carbon Project shows there could be 58t C/ha stored in hedgerows, while previous work carried out in assessing the carbon sink potential indicated potential to sequester 0.5t to 2.7t CO2/ha/year.
However, direct measurements of hedgerow biomass are required to quantify carbon stock changes for national greenhouse gas reporting for the land use change and forestry sector.
Overall aim
The overall goal is to create a habitat map for all farms that are involved in the Signpost Programme. Firstly, satellite and aerial photographs were used to digitise the woody habitats on the farms. Next, the total hectarage of the habitats was calculated to find out what percentage of the farm is covered by them. Once the hectarage of habitats has been established, we can then figure out their carbon sequestration potential.
The role of LiDAR is to figure out the biomass of the habitats and from there, the carbon sequestration of the habitats on the farms can be estimated. Data collected won’t be analysed for a few months until the results of the Farm Carbon project are published.
The role of LiDAR
One of the tools being used on the farms is light-distance and ranging (LiDAR) surveys. LiDAR is a laser-scanning technology that gives an accurate 3D picture of each farm. This 3D data is used to estimate the carbon stored in hedgerows and trees as it can accurately measure their physical characteristics.
LiDAR gives accurate measurements of hedgerow volume and new equations from the Teagasc Farm-Carbon project will be used to convert the volume of hedgerow into an estimate of the carbon stored in leaves, branches and roots.
The laser scan will also allow for better, more accurate, maps of on-farm biodiversity and can be used to look at how water flows across the farm.
Why is this work being carried out?
The Teagasc Signpost farms are being surveyed by LiDAR to provide a baseline measure of carbon stocks and habitat.
This will show a baseline for seeing how effective the Teagasc Signpost Programme is in terms of improving the carbon and sustainability profile of the farms over time.
This work is important because it gives a baseline of carbon storage on farms and allows farmers to examine if their carbon storage increases over time.
If it does increase, then this means that they have helped to offset some of the emissions produced on the farm.
Costs
The LiDAR scanning that Teagasc commissioned for this project costs up to a couple of thousand euro per farm, depending on farm size and how fragmented the land is.
The bigger the farm and the more fragmented it is, the more expensive the survey is.
There are cheaper ways to estimate hedgerow volume, however they are less precise.
A national LiDAR survey that is accessible to the public, Government bodies and researchers would provide the best baseline for all farmers.
On the other hand, basic mapping and satellite imagery can cost approximately €3.50 an acre, upwards to €30 or €40.
However, this is usually for solar and energy clients. For example, for a 60ac farm requesting full LiDAR and multi-spectral imagery, along with data processing and results, this would cost in the region of €2,500 to €3,000.
Conducting the survey
Bob Foley from Engineers with Drones was tasked with carrying out the surveying on the farms.
Using a drone to carry out this work is the most economical and efficient method, and it means Bob can easily cover 550 acres in a day.
Bob Foley from Engineers With Drones. \ Odhran Ducie
He captured three different types of data while on the farm.
These were LiDAR, multi-spectral imaging and standard RGB, which is essentially a colour photo. This is to allow for photogametry, which allows a 3D view, similar to what you would see on Google Maps 3D view.
The end product of LiDAR is a point cloud. This can be analysed to generate a green earth model to see streams, trees, and in the case of forestry, it even allows for the measurement of the height of the trees.
LiDAR works by pulsing out laser beams, which return a reflection, and it gradually builds a 3D image as it spins. LiDAR can pinpoint all the gaps in vegetation.
For example, an advanced use of LiDAR might be used in a forestry setting to measure the health of trees, to see on average how much they grow, or if you’re meeting growth targets, etc.
A close-up view of a LiDAR sensor on a DJI drone. \ Odhran Ducie
LiDAR can also measure ditches and hedgerows and the non-productive land on the farm to see how much vegetation exists, such as trees, bushes and hedgerows.
“LiDAR is metrically useful data, not just a pretty picture,” Bob says. “Fundamentally, you can measure how much vegetation there is, how much trees, bushes, hedgerows and see how diverse land is.”
Multi-spectral imaging was also carried out on the farms. This involves four or five cameras integrated into a single model and basically takes photos that look like what a bird would see, for example, as they see different wavelengths of light compared to humans. Using any one spectrum isn’t particularly useful, but using different spectrums and dividing them allows for the creation of indexes.
LiDAR image from Footprint Farmer Ciara Kinsella's farm
These are called NDVI and NDRE and are also known as vegetative indexes. NDRE stands for normalised difference red edge, which is a way of measuring the chlorophyll content in plants and NDVI is the dimension index, which tells you how much drought stress the plant is under.
“This data is useful because it can be used in precision agriculture systems to see which areas are under moisture stress,” explains Bob.
If you would like to speak to a member of our team, please call us on 01-4199525.
Link sent to your email address
We have sent an email to your address. Please click on the link in this email to reset your password. If you can't find it in your inbox, please check your spam folder. If you can't find the email, please call us on 01-4199525.
ENTER YOUR LOYALTY CODE:
The reader loyalty code gives you full access to the site from when you enter it until the following Wednesday at 9pm. Find your unique code on the back page of Irish Country Living every week.


SHARING OPTIONS