

Irish tillage farmers produce around 2.3m tonnes of cereals each year across 10,000 farms. Tillage farms represents just 8% of farms nationally and about half of these are specialist tillage units.
Specialist tillage units are described as generating more than two thirds of their farm revenue from crop production. Around 5,000 non-specialist farms grow tillage crops alongside livestock enterprises.
The figures come from a new report published by Tillage Industry Ireland earlier this week which details the economic impact of the tillage sector in the Irish economy.
The total area under tillage crops (cereals, oilseeds, pulses, potatoes, fodder beet, arable silages) amounts to 340,000ha, or 7.6% of national utilised agricultural area.
Cropping mix
Cereals make up the largest component of the tillage sector, covering approximately 280,000ha and an annual output of around 2.3m tonnes.
During 2014-2018, barley accounted for 57% of the tillage area, followed by wheat (19%) and oats (7%).
The main break crops of oilseeds, pulses, and potatoes each accounted 3% of tillage area, while fodder crops (maize, arable silage, and beet) accounted for 8% of tillage area.
Figure 1: national tillage crop mix (2014-2018 Average)

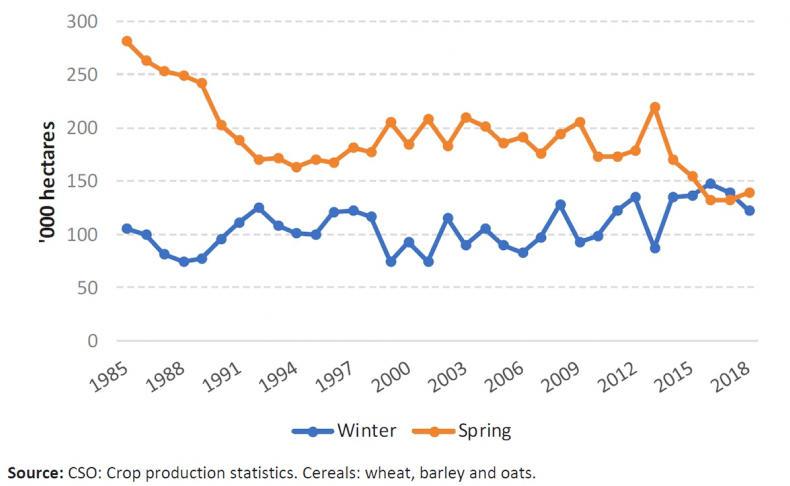
Figure 2 compares the trends in the areas of spring-sown versus winter-sown cereal crops over the period of 1985 to 2018.
The area of spring cereals declined sharply in the 1980s, stabilised over the 1990s and early 2000s, and dipped again in the mid-2010s. In contrast, the area of winter cereals has remained relatively stable over the period.
The shift towards winter wheat and winter barley reflects their superior gross margin performance, particularly compared to spring barley, and NFS figures suggest that this gross margin advantage has increased in the last decade or so.
Figure 2: trend in areas of spring sown and winter sown cereals
Reduction in area
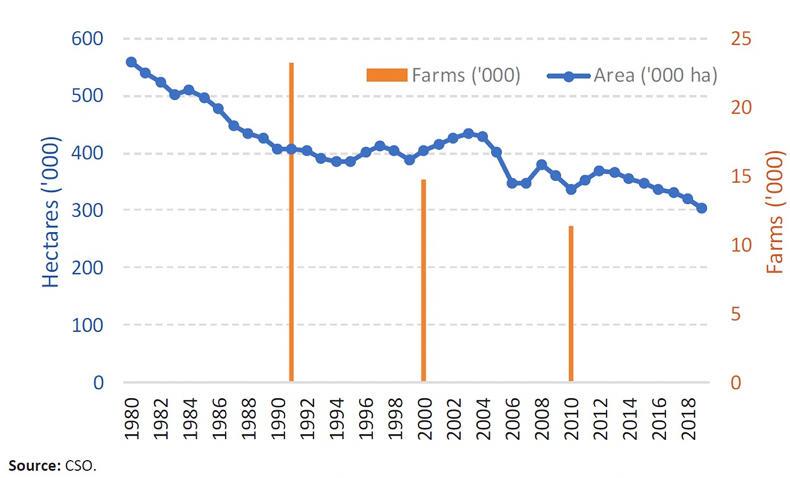
The area of tillage declined sharply in the 1980s before stabilising in the 1990s followed by a further period of decline since the mid-2000s. Between 1980 and 2018, the area of tillage crops nationally declined by over 230,000ha (42%), dropping from 9.8% to 7.1% of overall utilised agricultural area.
Consequently, the sector has been losing critical mass, and in percentage terms, the retreat has been most severe in areas outside the traditional tillage heartlands of the east and south east counties.
The area of potatoes grown has declined by 37% since 2008, reflecting changing consumer habits and increased substitution by alternative carbohydrate sources in the daily diet.
Figure 3: total area of tillage and number of farms with tillage crops
Regional breakdown
Figure 4 shows the regional variation in the percentage change in tillage area between 2008 and 2018. Nationally, tillage area fell by 57,000 hectares (15%) over the 10 years.
Figure 4. Change in tillage area by region between 2008 and 2018
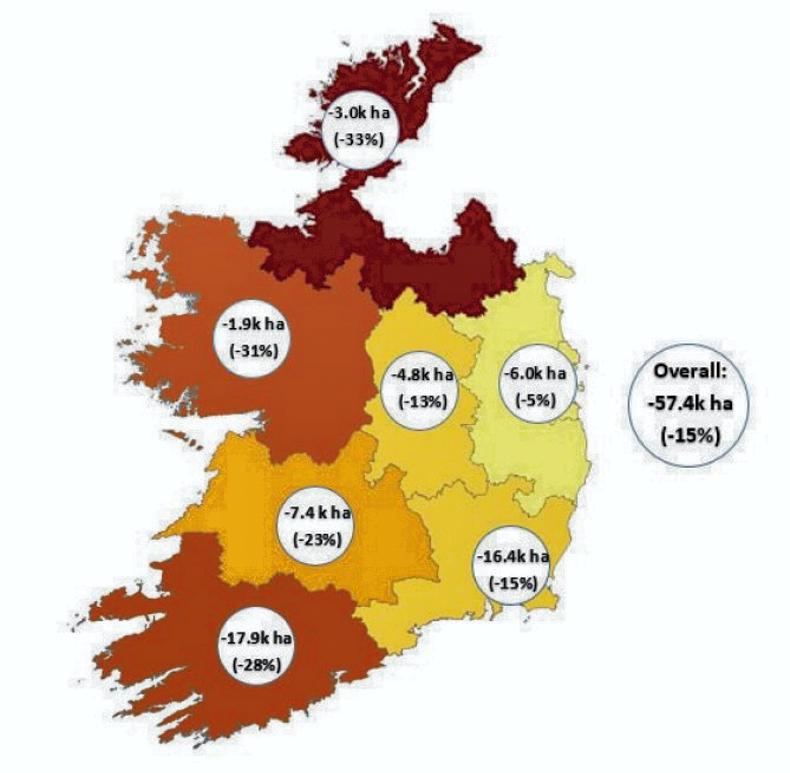
In percentage terms, the Border and West regions experienced the most pronounced reductions in tillage, but in the context of an already small tillage acreage. In these regions, cropping is usually a non-specialist activity that is maintained alongside livestock enterprises.
Nonetheless, in absolute terms, the largest reductions have been in traditional specialist tillage heartlands of the southeast and southwest, which together accounted for 60% of the national reduction in tillage acreage.
These areas have experienced strong dairy expansion since the abolition of milk quotas, and it can be inferred that the decrease in crop production here reflects a shift in land-use from tillage to dairy.
SHARING OPTIONS