In July, we published soil carbon results from the Footprint Farmers’ programme.
The results at that time took in 208 samples and were mainly from dairy, beef and sheep farms with a few fields of tillage included.
Crops were up in most cases at sampling time in April and May and so soil sampling was delayed until after harvest for most tillage crops. These results have now been added to the overall set, bringing the total number of samples to 291 on just under 900ha.
The samples were taken to a depth of 30cm and over a maximum area of 4ha each.
The average soil carbon figure dropped slightly from 74t of C/ha to 71t/ha when the remaining samples were added in.
It was clear from the results that farms and fields in tillage on a mixed farm, with grass in the crop rotation or that are using cover crops, had higher soil carbon levels than other tillage fields.
Most people would expect tillage farms to be lower in carbon than livestock farms and while they were generally low, they held their own on the Footprint Farms as the farmers are working to improve their soil health.
Approximately one-third of the soil carbon samples taken were from tillage fields. Sixty-five per cent of the tillage samples taken had soil carbon levels below 60t/ha.
The majority of the remaining 35% of samples had soil carbon levels of between 60t/ha and 80t/ha, while the remaining samples above 80t/ha and one over 130t/ha were in fields after cover crops and in rotation with grass.
In Co Louth, Gareth Culligan places huge emphasis on cover crops and this seems to be impacting positively on his soil carbon levels. In the season gone by, he added sheep to the system and this is bringing another source of organic matter to the fold and helping with soil biology.
Grass in the rotation is a big advantage
Andrew Mulhare in Co Laois and Pádraig Connery in Co Waterford both have cattle on the farm and the slurry and farmyard manure all help with soil health, but grass in the rotation is a big advantage.
These fields will need to be sampled again in two to three years’ time to calculate if carbon increases, decreases or stays the same.
There are positives to be taken from these samples.
The low soil carbon levels have the potential to increase and maybe quickly, while the higher levels show that not all tillage land is depleted of soil carbon and this is a positive on the soil health front.
Why measure soil carbon?
Soil carbon is directly related to soil organic matter and high levels are a positive for soil health.
Bugs in the soil need food and when soil organic matter is broken down by bugs, nutrients can be released.
If soil carbon levels increase, this is also an indication that carbon is being stored in the soil. This means carbon is being taken from the atmosphere through plants and stored in the soil. This helps to offset carbon emissions.

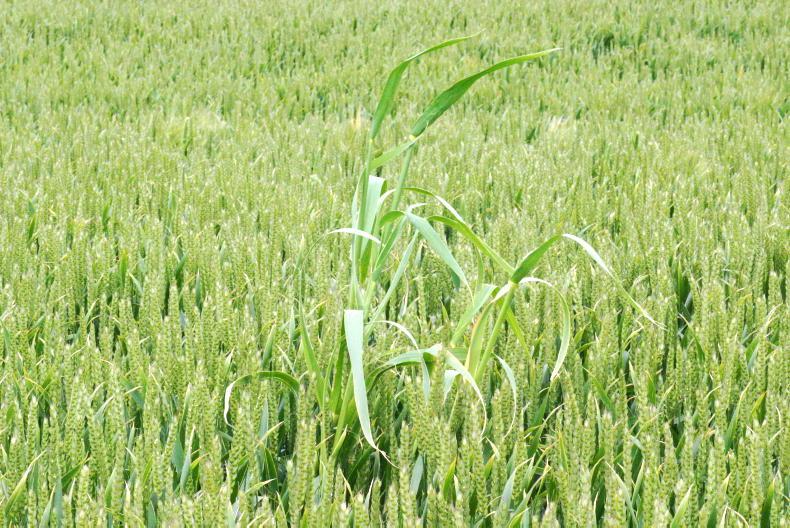
A multispecies cover crop on Gareth Culligan's farm in Co Louth.
When comparing the soil carbon results in tillage and grassland, the average is lower in tillage land, as would be expected. The lower figures in the grassland samples look to be on land that was previously in tillage.
Positives
There are positives to be taken from these results. The first is that tillage land has huge potential to store more carbon, as does much of the grassland which was soil-sampled.
The tillage farmers in this project are all sowing cover crops and some are rotating with grass.
These fields are showing higher soil carbon levels. So, the practices look to be contributing to higher soil carbon levels.
These farmers are improving their soil health, while also working on offsetting their carbon emissions.
Soil carbon results
from the tillage farms
Lowest – 25.17t C/ha.Highest – 132.9t C/ha.Average – 58.27t C/ha.Soil carbon results
from grassland farms
Lowest – 19.9t/ha.Highest – 313.9t/ha.Average – 77.52t/ha.
In July, we published soil carbon results from the Footprint Farmers’ programme.
The results at that time took in 208 samples and were mainly from dairy, beef and sheep farms with a few fields of tillage included.
Crops were up in most cases at sampling time in April and May and so soil sampling was delayed until after harvest for most tillage crops. These results have now been added to the overall set, bringing the total number of samples to 291 on just under 900ha.
The samples were taken to a depth of 30cm and over a maximum area of 4ha each.
The average soil carbon figure dropped slightly from 74t of C/ha to 71t/ha when the remaining samples were added in.
It was clear from the results that farms and fields in tillage on a mixed farm, with grass in the crop rotation or that are using cover crops, had higher soil carbon levels than other tillage fields.
Most people would expect tillage farms to be lower in carbon than livestock farms and while they were generally low, they held their own on the Footprint Farms as the farmers are working to improve their soil health.
Approximately one-third of the soil carbon samples taken were from tillage fields. Sixty-five per cent of the tillage samples taken had soil carbon levels below 60t/ha.
The majority of the remaining 35% of samples had soil carbon levels of between 60t/ha and 80t/ha, while the remaining samples above 80t/ha and one over 130t/ha were in fields after cover crops and in rotation with grass.
In Co Louth, Gareth Culligan places huge emphasis on cover crops and this seems to be impacting positively on his soil carbon levels. In the season gone by, he added sheep to the system and this is bringing another source of organic matter to the fold and helping with soil biology.
Grass in the rotation is a big advantage
Andrew Mulhare in Co Laois and Pádraig Connery in Co Waterford both have cattle on the farm and the slurry and farmyard manure all help with soil health, but grass in the rotation is a big advantage.
These fields will need to be sampled again in two to three years’ time to calculate if carbon increases, decreases or stays the same.
There are positives to be taken from these samples.
The low soil carbon levels have the potential to increase and maybe quickly, while the higher levels show that not all tillage land is depleted of soil carbon and this is a positive on the soil health front.
Why measure soil carbon?
Soil carbon is directly related to soil organic matter and high levels are a positive for soil health.
Bugs in the soil need food and when soil organic matter is broken down by bugs, nutrients can be released.
If soil carbon levels increase, this is also an indication that carbon is being stored in the soil. This means carbon is being taken from the atmosphere through plants and stored in the soil. This helps to offset carbon emissions.
A multispecies cover crop on Gareth Culligan's farm in Co Louth.
When comparing the soil carbon results in tillage and grassland, the average is lower in tillage land, as would be expected. The lower figures in the grassland samples look to be on land that was previously in tillage.
Positives
There are positives to be taken from these results. The first is that tillage land has huge potential to store more carbon, as does much of the grassland which was soil-sampled.
The tillage farmers in this project are all sowing cover crops and some are rotating with grass.
These fields are showing higher soil carbon levels. So, the practices look to be contributing to higher soil carbon levels.
These farmers are improving their soil health, while also working on offsetting their carbon emissions.
Soil carbon results
from the tillage farms
Lowest – 25.17t C/ha.Highest – 132.9t C/ha.Average – 58.27t C/ha.Soil carbon results
from grassland farms
Lowest – 19.9t/ha.Highest – 313.9t/ha.Average – 77.52t/ha. 


SHARING OPTIONS