All types of farms across the country have a nature value, from hill farms to lowland farms, a new land classification map of the Republic of Ireland shows.
The map was published in the Journal of Environmental Management
and divides the country into nine broad landscape classes, each with distinct environmental characteristics.
One of the co-authors of the study, lecturer in ecology and biology at GMIT James Moran, told the Irish Farmers Journal that the map shows one size does not fit all in terms of policy.
Listen to "Classification of land" on Spreaker.
“When we are designing monitoring programmes as well, we have to ensure that we take into account the diversity of the land situation,” he said.
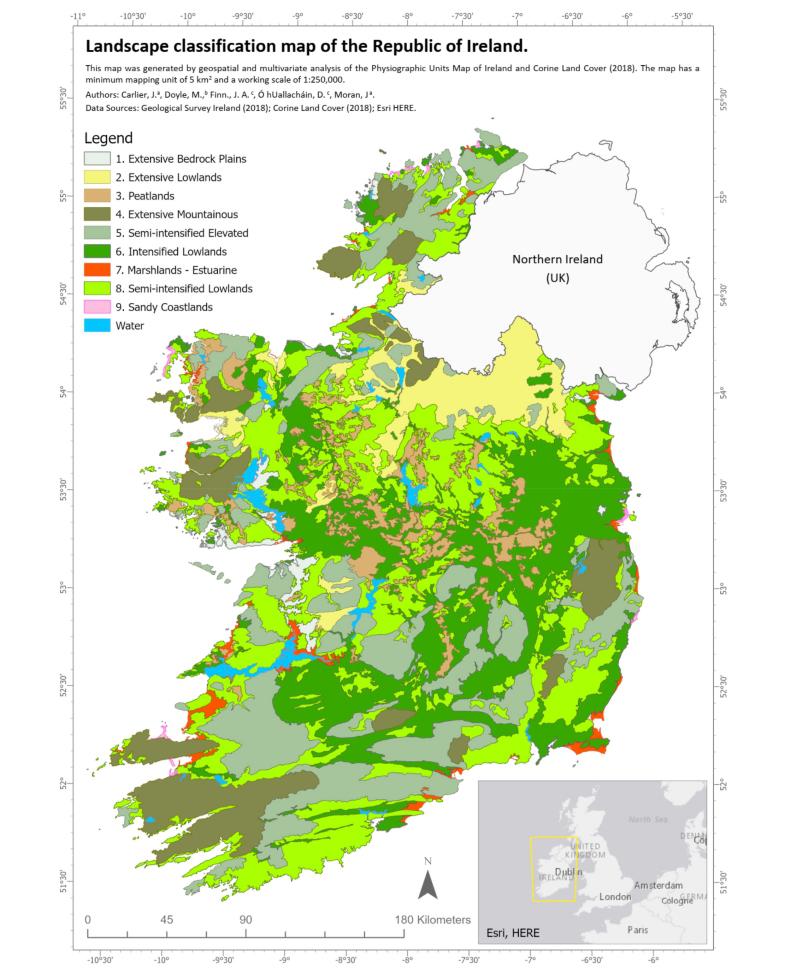
Landscape classification map based on nine clusters of PU land cover composition. \ J. Carlier et al, Journal of Environmental Management 289 (2021) 112498
High-nature-value farming
Moran said a previous study which mapped high-nature-value (HNV) farmland found it essentially mirrors the land use intensity or the capacity of land in the country to produce food.
“So you have this situation where, in this map here, the intensive lowlands would be dominated by high-food-production-capacity landscapes.
“Then as you move uplands and move westwards into more difficult, high-rainfall areas in the west and northwest, you have natural constraints on food production. But the way [these] agricultural landscapes have evolved they have large amounts of farmed semi-natural vegetation that makes them very important from a high-nature-value farming perspective,” he said.
Overlaying this new land classification map with the HNV map, Moran said each landscape was scored on a scale of one and five for its nature value.#
“The interesting point in this, I think, is across all our landscapes, even our intensified lowlands, we have scores up around three.
“The highest score of a landscape for high-nature-value farming is the extensive mountainous regions which have a score of four. This really highlights that all our landscapes, as well as having a production value, also have a nature value, have a carbon sequestration value, and have a biodiversity value as well. But the balance is different between them,” he said.
He added that certain land is naturally advantaged from the point of view of deeper fertile soils for food and fibre production and other land, which would be considered naturally disadvantaged for food production, is now highly valued for the other services. “It’s raising the potential of that land so it’s not marginal anymore, but it’s also of high value for a particular type and we just call it high nature value rather than marginal,” he said.
Farm incomes
“There seems to be a dichotomy coming, and it’s not realising that even the more intensive land has a value for nature – and has to have a value for nature – and we have to have those services in those areas as well.
“These areas also have a value for food production, as well as the nature value, but it’s the balance of where a farmer might make his income from.
“He might make more from certain services rather than others if you match the capacity of the land to the opportunities that are given by policy. That’s the big thing from the policy side. We have to design it in a way that basically on both types of land that farmers are viable producing the services that that land has the capacity for,” he said.
Monitor farms
With carbon farming coming down the tracks, Moran said these nine landscape classes need to be taken into account when carbon monitoring is being set up on farms. This will show what the farm is emitting and what it is sequestering.
“Without this type of map, we have the risk of maybe placing all our monitoring stations in one particular type of landscape, having a lot of information from that and then having insufficient information to model and take into account what’s happening in other landscapes,” he said.
Moran questioned if the National Farm Survey is representative of farming across the nine landscapes and in terms of monitor farms under Teagasc’s Signpost Farms.
“When we set up our Signpost series monitoring farms into the future, is it going to be spread across these landscapes or is it going to be highly concentrated in some areas?
“If it is highly concentrated in some areas it’s not maybe a problem, but we need to realise then that any information that comes from it is only useful in forming policy in that particular context,” he said.
Moran added that the smallest unit on the map is 5sq km and that the map cannot be applied for designating land, but instead gives a broad picture of the landscape.
All types of farms across the country have a nature value, from hill farms to lowland farms, a new land classification map of the Republic of Ireland shows.
The map was published in the Journal of Environmental Management
and divides the country into nine broad landscape classes, each with distinct environmental characteristics.
One of the co-authors of the study, lecturer in ecology and biology at GMIT James Moran, told the Irish Farmers Journal that the map shows one size does not fit all in terms of policy.
Listen to "Classification of land" on Spreaker.
“When we are designing monitoring programmes as well, we have to ensure that we take into account the diversity of the land situation,” he said.
Landscape classification map based on nine clusters of PU land cover composition. \ J. Carlier et al, Journal of Environmental Management 289 (2021) 112498
High-nature-value farming
Moran said a previous study which mapped high-nature-value (HNV) farmland found it essentially mirrors the land use intensity or the capacity of land in the country to produce food.
“So you have this situation where, in this map here, the intensive lowlands would be dominated by high-food-production-capacity landscapes.
“Then as you move uplands and move westwards into more difficult, high-rainfall areas in the west and northwest, you have natural constraints on food production. But the way [these] agricultural landscapes have evolved they have large amounts of farmed semi-natural vegetation that makes them very important from a high-nature-value farming perspective,” he said.
Overlaying this new land classification map with the HNV map, Moran said each landscape was scored on a scale of one and five for its nature value.#
“The interesting point in this, I think, is across all our landscapes, even our intensified lowlands, we have scores up around three.
“The highest score of a landscape for high-nature-value farming is the extensive mountainous regions which have a score of four. This really highlights that all our landscapes, as well as having a production value, also have a nature value, have a carbon sequestration value, and have a biodiversity value as well. But the balance is different between them,” he said.
He added that certain land is naturally advantaged from the point of view of deeper fertile soils for food and fibre production and other land, which would be considered naturally disadvantaged for food production, is now highly valued for the other services. “It’s raising the potential of that land so it’s not marginal anymore, but it’s also of high value for a particular type and we just call it high nature value rather than marginal,” he said.
Farm incomes
“There seems to be a dichotomy coming, and it’s not realising that even the more intensive land has a value for nature – and has to have a value for nature – and we have to have those services in those areas as well.
“These areas also have a value for food production, as well as the nature value, but it’s the balance of where a farmer might make his income from.
“He might make more from certain services rather than others if you match the capacity of the land to the opportunities that are given by policy. That’s the big thing from the policy side. We have to design it in a way that basically on both types of land that farmers are viable producing the services that that land has the capacity for,” he said.
Monitor farms
With carbon farming coming down the tracks, Moran said these nine landscape classes need to be taken into account when carbon monitoring is being set up on farms. This will show what the farm is emitting and what it is sequestering.
“Without this type of map, we have the risk of maybe placing all our monitoring stations in one particular type of landscape, having a lot of information from that and then having insufficient information to model and take into account what’s happening in other landscapes,” he said.
Moran questioned if the National Farm Survey is representative of farming across the nine landscapes and in terms of monitor farms under Teagasc’s Signpost Farms.
“When we set up our Signpost series monitoring farms into the future, is it going to be spread across these landscapes or is it going to be highly concentrated in some areas?
“If it is highly concentrated in some areas it’s not maybe a problem, but we need to realise then that any information that comes from it is only useful in forming policy in that particular context,” he said.
Moran added that the smallest unit on the map is 5sq km and that the map cannot be applied for designating land, but instead gives a broad picture of the landscape.


SHARING OPTIONS