Irish tillage farming is one of the most environmentally friendly of all sectors. It has a low carbon footprint, high nitrogen use efficiency and farmers are meeting the target set out in the country’s Climate Action Plan. Unfortunately, despite all this, tillage is not the best on economics.
On this page, we provide you with some of the key facts and statistics as a cut out-and-keep guide to tillage farming in Ireland, so you will know your sector and have the information to make sure everyone else knows the benefits as well.
Carbon footprint
The carbon footprint is 1.7t CO2eq/ha, down from 2.2t CO2eq/ha in 2020. It was also at 1.7t CO2eq/ha in 2023. In comparison to other sectors, tillage farmers produced 0.8kg CO2eq per euro of output in 2024.
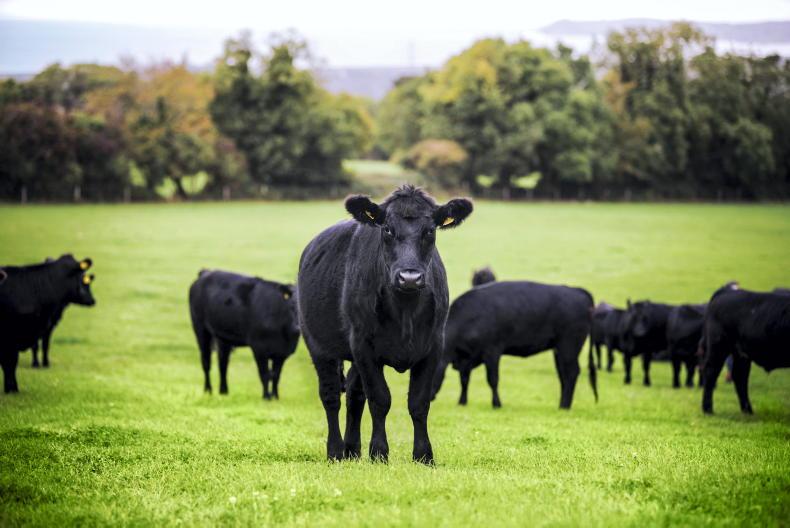
However, only 26.5% of emissions on tillage farms actually came from crop production. The remainder came from livestock production.
Ammonia
Ammonia (NH3) emissions were 9.6kg NH3/ha. An estimated 38% of this came from tillage, but the remainder came from livestock on the farms. The highest of the previous six years was 11.4kg NH3/ha.
Nutrient balances
Tillage farms generally have very good nutrient balances. In 2024, the N use efficiency (NUE) on tillage farms was 70.4%. The nitrogen balance in 2024 was 34.4kg N/ha. The highest figure in the past six years was 38.5kg N/ha in 2023. This figure is the amount of nitrogen left over, so the amount of nitrogen applied minus the amount estimated to be taken up. The phosphorus (P) balance for the same year was 3kg P/ha. This figure hit 6.1kg P/ha in 2020. The P use efficiency in 2024 was 91.7% across all tillage farms.
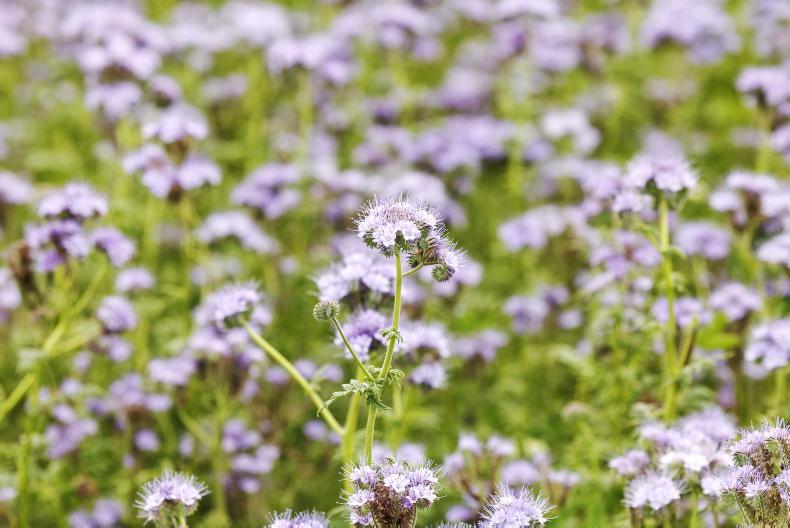
Cover crops have increased in number and the target in the Climate Axction Plan has been reached. \ Donal O' Leary
Targets
The Climate Action Plan outlines three main targets for the tillage sector. The first is to increase the tillage area to 360,000ha by 2025 and 400,000ha by 2030. This is an extremely ambitious target which has not been met, as tillage farmers struggle with incomes and access to land.
The second and third actions are to increase straw incorporation levels and cover crop area. These targets have increased in recent years. In 2023, the Climate Action Plan outlined a target to incorporate 35,000ha of cereal straw by 2025 and 55,000ha by 2030. In 2024, these targets increased to 65,000ha by 2025 and 85,000ha by 2030. This is despite the tillage area failing to increase and even declining.
In 2023, 56,700ha of cereal straw were incorporated, meeting the target in the Climate Action Plan, while a further 13,900ha of oilseed rape stalks were chopped. In 2024, 28,872ha of cereal straw were chopped. A total of 44,123ha had been entered into the scheme, but farmers were paid to bale straw due to a shortage.
In 2025, 66,482ha were entered into the measure, 57,314.2ha of this area is cereal straw, but some applicants have withdrawn since that time.
Cover crop area had been estimated at about 40,000ha in recent years, but it is hard to estimate, with about 25,000ha planted under ACRES and farmers planting themselves. This year the Farming for Water project saw over 30,000ha applied for, so it is likely the cover crop area is hitting 55,000ha. The targets for cover crops in the Climate Action Plan are 45,000ha by 2025, which has likely been met. The 2030 target is to plant 75,000ha, but this is an ambitious target in a struggling tillage sector.
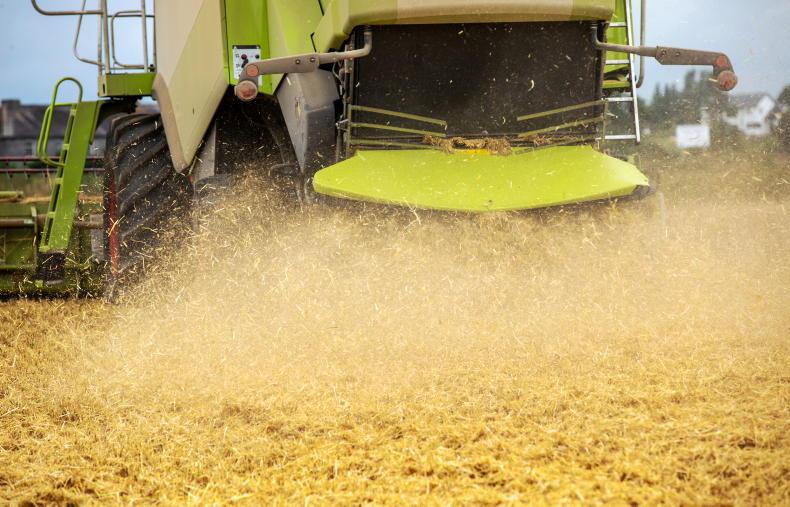
New straw incorporation targets are ambitious. / Claire Nash
The bottom line
Many tillage farmers are not making money. In 2024, Teagasc found that only 57% of tillage farms were economically viable.
The National Farm Survey outlined that the average family farm income on tillage farms was €1,110/ha from the top-performing cohort and was €227/ha for the bottom performers.
Household vulnerability was at 17%, isolation risk was at 14%, while 28% of farms had a high age profile in 2024.

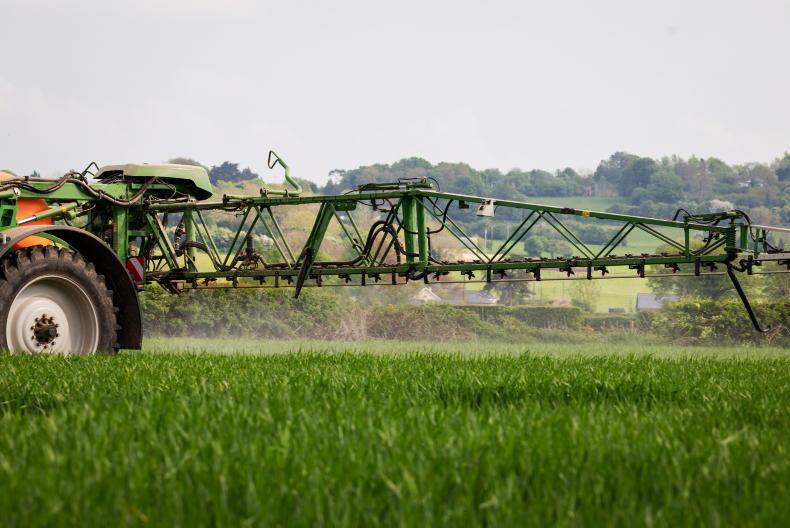
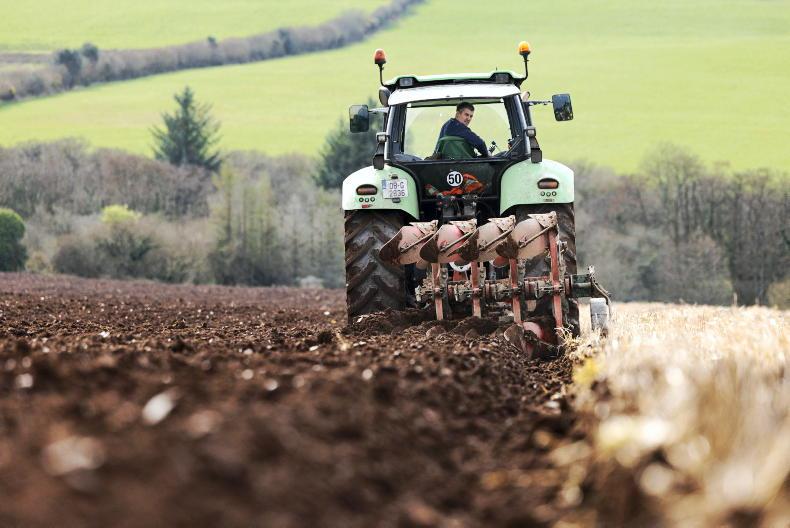
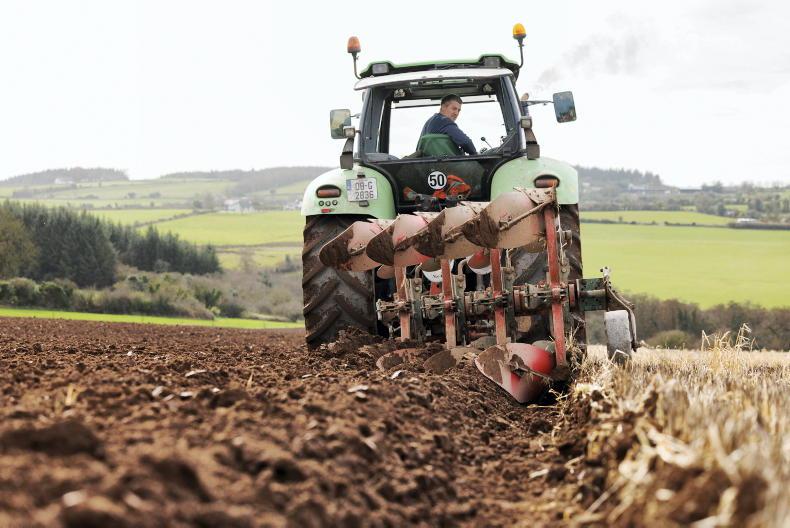
Tillage has a low carbon footprint. \ Donal O' Leary
Net margin on tillage farms estimated up €35/ha from poor 2024 figure
The net margin on tillage farms is estimated to have increased in 2025, according to the Teagasc Review and Outlook report. However, this comes with a warning, as in 2024 the net margin on tillage farms ranged from -€316/ha to +€764/ha. The net margin on the average cereal enterprise in 2025 was estimated at €270/ha, which was up €35/ha on 2024. The average net margin on the best-performing one-third of tillage farms was estimated at €410/ha.
Spring barley gross margin was reported to be down €135/ha on 2024, while winter wheat margin was up €170/ha on 2024.
Winter crop yields and outputs looked to have helped incomes with good weather conditions at sowing, grain fill and harvest helping yields. For example, winter wheat yield was estimated up 19%, while spring barley performed poorly for many.
The report noted: “Harvest prices in the cereals sector in 2025, compared to 2024, were lower, with some prices slightly lower than others. Furthermore, yields for the major Irish cereal crops were mixed, with some crops tending to yield lower, while other crops tended to yield higher than those achieved at harvest 2024. Taken together, these developments resulted in mixed gross output values on a per hectare basis in 2025 relative to 2024. In addition, direct costs of production in 2025, remained at relatively high levels.”
Falling grain prices
Teagasc estimates barley and wheat prices fell by about 10% in 2025 and does not expect an increase in the near future. The report stated: “Significant increases in EU and international production levels resulted in significant downward movement in farm gate cereal prices paid at harvest 2025, compared to 2024.”
Teagasc reported that fertiliser prices went up 3% and fertiliser use was up slightly on 2024. Seed prices did not change. Other direct costs went up 1%, while green diesel prices went down 3%.
It should be noted that these figures come from the Teagasc National Farm Survey and are based on the cereal enterprise of specialist tillage farms. The margins reported do not include basic payments or schemes.
The facts and figures in this article were compiled from a number of sources. Emissions, nutrients, social sustainability and economic figures came from Teagasc. Straw figures are from the Department of Agriculture, Food and the Marine, cover crop areas are gathered from the Farming for Water programme, Department, Teagasc and industry estimates.
Irish tillage farming is one of the most environmentally friendly of all sectors. It has a low carbon footprint, high nitrogen use efficiency and farmers are meeting the target set out in the country’s Climate Action Plan. Unfortunately, despite all this, tillage is not the best on economics.
On this page, we provide you with some of the key facts and statistics as a cut out-and-keep guide to tillage farming in Ireland, so you will know your sector and have the information to make sure everyone else knows the benefits as well.
Carbon footprint
The carbon footprint is 1.7t CO2eq/ha, down from 2.2t CO2eq/ha in 2020. It was also at 1.7t CO2eq/ha in 2023. In comparison to other sectors, tillage farmers produced 0.8kg CO2eq per euro of output in 2024.
However, only 26.5% of emissions on tillage farms actually came from crop production. The remainder came from livestock production.
Ammonia
Ammonia (NH3) emissions were 9.6kg NH3/ha. An estimated 38% of this came from tillage, but the remainder came from livestock on the farms. The highest of the previous six years was 11.4kg NH3/ha.
Nutrient balances
Tillage farms generally have very good nutrient balances. In 2024, the N use efficiency (NUE) on tillage farms was 70.4%. The nitrogen balance in 2024 was 34.4kg N/ha. The highest figure in the past six years was 38.5kg N/ha in 2023. This figure is the amount of nitrogen left over, so the amount of nitrogen applied minus the amount estimated to be taken up. The phosphorus (P) balance for the same year was 3kg P/ha. This figure hit 6.1kg P/ha in 2020. The P use efficiency in 2024 was 91.7% across all tillage farms.
Cover crops have increased in number and the target in the Climate Axction Plan has been reached. \ Donal O' Leary
Targets
The Climate Action Plan outlines three main targets for the tillage sector. The first is to increase the tillage area to 360,000ha by 2025 and 400,000ha by 2030. This is an extremely ambitious target which has not been met, as tillage farmers struggle with incomes and access to land.
The second and third actions are to increase straw incorporation levels and cover crop area. These targets have increased in recent years. In 2023, the Climate Action Plan outlined a target to incorporate 35,000ha of cereal straw by 2025 and 55,000ha by 2030. In 2024, these targets increased to 65,000ha by 2025 and 85,000ha by 2030. This is despite the tillage area failing to increase and even declining.
In 2023, 56,700ha of cereal straw were incorporated, meeting the target in the Climate Action Plan, while a further 13,900ha of oilseed rape stalks were chopped. In 2024, 28,872ha of cereal straw were chopped. A total of 44,123ha had been entered into the scheme, but farmers were paid to bale straw due to a shortage.
In 2025, 66,482ha were entered into the measure, 57,314.2ha of this area is cereal straw, but some applicants have withdrawn since that time.
Cover crop area had been estimated at about 40,000ha in recent years, but it is hard to estimate, with about 25,000ha planted under ACRES and farmers planting themselves. This year the Farming for Water project saw over 30,000ha applied for, so it is likely the cover crop area is hitting 55,000ha. The targets for cover crops in the Climate Action Plan are 45,000ha by 2025, which has likely been met. The 2030 target is to plant 75,000ha, but this is an ambitious target in a struggling tillage sector.
New straw incorporation targets are ambitious. / Claire Nash
The bottom line
Many tillage farmers are not making money. In 2024, Teagasc found that only 57% of tillage farms were economically viable.
The National Farm Survey outlined that the average family farm income on tillage farms was €1,110/ha from the top-performing cohort and was €227/ha for the bottom performers.
Household vulnerability was at 17%, isolation risk was at 14%, while 28% of farms had a high age profile in 2024.
Tillage has a low carbon footprint. \ Donal O' Leary
Net margin on tillage farms estimated up €35/ha from poor 2024 figure
The net margin on tillage farms is estimated to have increased in 2025, according to the Teagasc Review and Outlook report. However, this comes with a warning, as in 2024 the net margin on tillage farms ranged from -€316/ha to +€764/ha. The net margin on the average cereal enterprise in 2025 was estimated at €270/ha, which was up €35/ha on 2024. The average net margin on the best-performing one-third of tillage farms was estimated at €410/ha.
Spring barley gross margin was reported to be down €135/ha on 2024, while winter wheat margin was up €170/ha on 2024.
Winter crop yields and outputs looked to have helped incomes with good weather conditions at sowing, grain fill and harvest helping yields. For example, winter wheat yield was estimated up 19%, while spring barley performed poorly for many.
The report noted: “Harvest prices in the cereals sector in 2025, compared to 2024, were lower, with some prices slightly lower than others. Furthermore, yields for the major Irish cereal crops were mixed, with some crops tending to yield lower, while other crops tended to yield higher than those achieved at harvest 2024. Taken together, these developments resulted in mixed gross output values on a per hectare basis in 2025 relative to 2024. In addition, direct costs of production in 2025, remained at relatively high levels.”
Falling grain prices
Teagasc estimates barley and wheat prices fell by about 10% in 2025 and does not expect an increase in the near future. The report stated: “Significant increases in EU and international production levels resulted in significant downward movement in farm gate cereal prices paid at harvest 2025, compared to 2024.”
Teagasc reported that fertiliser prices went up 3% and fertiliser use was up slightly on 2024. Seed prices did not change. Other direct costs went up 1%, while green diesel prices went down 3%.
It should be noted that these figures come from the Teagasc National Farm Survey and are based on the cereal enterprise of specialist tillage farms. The margins reported do not include basic payments or schemes.
The facts and figures in this article were compiled from a number of sources. Emissions, nutrients, social sustainability and economic figures came from Teagasc. Straw figures are from the Department of Agriculture, Food and the Marine, cover crop areas are gathered from the Farming for Water programme, Department, Teagasc and industry estimates.


SHARING OPTIONS