

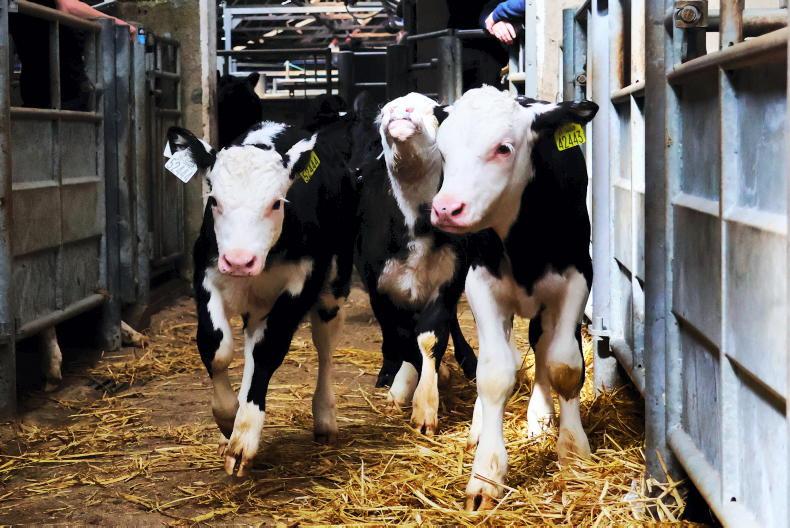
Net margin averaged €208/head on the Thrive demonstration farm in Cashel, Co Tipperary, this year, up from €132/head in 2021. However, as with every batch of stock, there was a range in performance, both physical and financial.
Because we are recording every detail on the farm we know down to the last kilo of meal what each individual animal has eaten during its lifetime. This allows us to calculate a gross and net margin for each individual animal that goes through the system.
The highest individual net margin was for a Charolais bullock that had a carcase weight of 380kg at 20.6 months and graded R- 3+ coming into €1,880. The lowest net margin was -€62 for a Hereford heifer that graded O=3=, had a 241kg carcase at 21 months, and came to a value of €1,140.
However, there were Hereford cattle in the top 10% for net margin within the batch as well. This highlights the challenge with dairy beef in identifying the good from the bad.
The need for CBV
The programme is using 100% AI, high beef merit, dairy beef index (DBI) sires to try and maximise the beef characteristics of the animal, and to a large extent that has been very successful.
However, it is still only half the picture. No matter how good the bull is, if the cow is not bringing the goods to the table, the resultant calf will still struggle to leave a profit.
The introduction of CBV will take both the sire and the dam into consideration and give farmers a figure that will reflect their beef genetic potential. It focuses on key beef traits such as carcase weight, conformation, fat score, feed intake and docility.
It is expressed as a euro value, similar to the terminal and replacement indices that farmers will already be familiar with. It is also broken into three breed types – suckler (beef sire x beef dam), dairy x beef (dairy dam x beef sire or vice versa), and dairy x dairy (dairy dam x dairy sire).
Thrive demonstration cattle
Looking at the CBVs for the 2021-born stock on the Thrive demo farm, they ranged from €10 to €220. But the question is, did the actual performance, both physical and financial, back up what the CBVs suggested?
Table 1 breaks down the stock into the top, middle, and bottom thirds based on the CBV of the animal and looks at some key performance indicators of the animals.
First of all, the bottom third of cattle had an average CBV of €43, the average was €63 and the top third were €129.
Looking at calf price, the highest CBV calves were costing more. This is due to the fact that the continental calves have the highest CBV and they are costing more as calves, especially the Belgian Blues. However, it is worth noting that the makeup of the top third based on CBV is also heavily populated by Hereford and Angus cattle.
In terms of carcase weight, the top third of cattle based on CBV were delivering an 18kg heavier carcase compared to the rest while the bottom and middle thirds were similar at 283kg. The bottom third tended to grade a half-score lower for conformation while the top third tended to be a bit leaner than the rest, although still comfortably sitting within carcase specification limits.
The base price did not differ greatly between the groups as you would expect but looking at the 20c/kg in-spec bonus, the bottom third secured less of this payment than the others, due to the fact that more of these animals graded below an O=.
The total price paid includes any breed bonus for Angus and Hereford cattle as well as some stock receiving a 10c/kg weight bonus for being over 300kg (stock slaughtered in Foyle Meats, Donegal). Again the bottom third had the lowest beef price paid due to increased issues around carcase specification.
Interestingly, the middle third had the highest beef price paid. This is because it is almost completely made up of Angus and Hereford cattle which received a breed bonus payment while the continental cattle in the top third did not.
Age at slaughter can play a key role in reducing the total emissions from livestock production systems. Although these animals are already well below the national average with a mean slaughter age of just over 20 months, there were some differences between the different groups. The bottom third were more than a week older than the average despite having the same carcase weight, while the top third were five days older than the average, but had 18kg more carcase.
Financial performance
When it comes to carcase value, the bottom third were worth €16 less than the average and €90 less than the top third of CBV animals.
The size of the cheque does not directly convert to the size of the profit, however, with the cost of production hugely important. Looking at the net margin per head, the average was €214. The bottom third left €175/head, €39/head less than the average (more than double the difference in carcase value), while the top third had the highest net margin at €245/head, €31/head more than the average.
The results are positive, the CBV is a step in the right direction as it is predicting the general trend within the group of cattle.
There are exceptions to the rule of course. There are animals with high CBVs with low net margins and vice versa. This is due to incorrect sires or dams being recorded. Having genotyped these animals we know that the sire error is 15%, which would be lower than in previous years.
The CBVs reported here are the figures before the animals were DNA-tested on the demonstration farm. It was decided to report the figures this way as this is the level of information that most farmers will have access to.
To get to a higher level of accuracy, every calf needs to be DNA-tagged at birth. This is the only way to deliver highly accurate figures to farmers.
There is a huge attrition rate in dairy beef farmer numbers, due to low profitability and perceived poor calf quality. With the dairy herd now coming to more stable numbers and with the increased use of sexed semen, the number of beef-sired animals coming through the system is set to increase significantly in the coming years, with ICBF forecasting an additional 300,000 beef-sired dairy calves by 2027. There is also the looming question over live exports of calves in the coming years.
If beef farmers are to continue to rear dairy beef animals then both the quality of the calf and the accuracy of the genetic data at the point of purchase needs to improve – for both the dairy and beef sectors’ sake.

SHARING OPTIONS