

Last spring, the Footprint Farmers’ farms were soil-sampled to a depth of 10cm. Over 200 samples were taken across the farms. More samples will be taken in the coming months as areas which had received slurry, farmyard manure or lime before sampling were not tested. There are dairy, beef, sheep and tillage farms in the mix.
The samples were tested for soil pH, nitrogen (N), phosphorus (P), potassium (K), magnesium (Mg), Calcium (Ca), Manganese (Mn), Zinc (Zn) and Boron (B).
Samples were also tested for soil organic carbon and these results will be detailed in the coming months.
Teagasc generally reports that only 20% of soil samples in Ireland are at optimum levels for soil pH, P and K , so we were interested to see how the Footprint Farmers fared out.
In this article we take a close look at the soil sample results gathered from the Footprint Farmers.
What samples were close to optimum?
On a really positive note, 40% of the samples were at index 3 or 4 for both P and K, while 22% were at index 3 or 4 for P or K and were also at a soil pH of 6.3 or over.
A soil pH of around 6.3 to 6.5 is optimum on grassland, while cereal crops grow best at a soil pH of about 6.5.
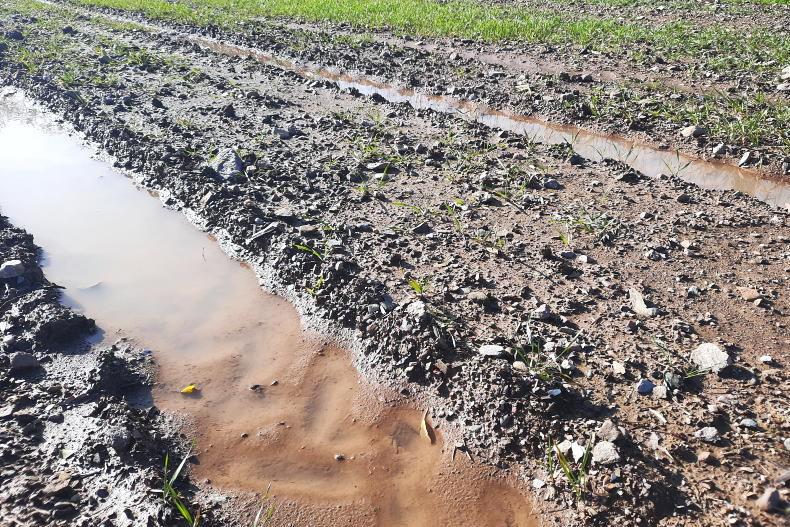
Over half of samples were below a soil pH of 6.3, with 33% below 6, needing action immediately. A positive 27% were at a soil pH of 6.3 to 6.5, while 18% were above this level.
Looking at the samples at index 3 and 4 for P and K, 22% of these samples were at a soil pH of 6-6.2, while a further 22% of soils were in bad need of lime at pH levels below 6.
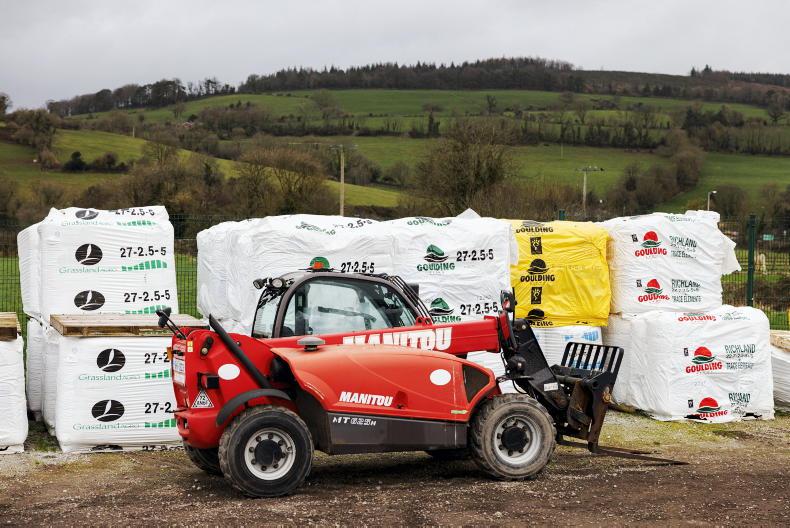
When it comes to fertiliser, lime is the cheapest investment a farmer can make. Forty-four per cent of the soil samples had good P and K levels, but low soil pH.
This P and K would most likely become more available if soil pH was corrected. It will be interesting to compare how fields perform on farms where P and K is high, but soil pH is low. We will also keep an eye to the high soil pH levels.
While the average P index across the samples was 3, almost 36% of the soil samples returned a P index of 4. Thirty per cent of samples were at index 3, with 24% at index 2 and just 10% at index 1.
The average across soil samples for potassium was index 3. Thirty-two per cent of the total samples were at index 3, while 37% were at index 2, 18% were at index 4 and 13% were at index 1.
Low indices
It’s hard to pinpoint any one reason for the lower indices. Much of the K deficiencies are on silage ground, which makes sense and can be addressed by returning slurry to silage ground or putting more emphasis on K application.
As compounds generally associated with silage fertiliser can be low in K it may be a case of topping up with a straight. However, with high prices ahead of us, the focus should be on using slurry in the early part of the season and farmyard manure containing straw in the autumn. Reseeding is a great time to apply some farmyard manure.
On farms where soil pH and K index levels are good, farmers can start to look at other elements. Magnesium, manganese, calcium, copper, zinc and boron were tested for in these soil samples.
Many of these deficiencies are often associated with areas of the country and are dependent on different soil types and bedrocks.
Some of the standout results here were high levels of copper and zinc and low boron levels. While copper might be high in the soil, it might not necessarily be high in forage. In fact, liming can sometimes reduce its availability, so forage should be tested where there is a concern about copper deficiency in animals.
Boron, which is important for cell formation and plant growth, should only be applied in small amounts as it can be toxic at high levels. Boron is commonly applied to beet or brassica crops, but caution is needed when applying boron on other crops.


SHARING OPTIONS