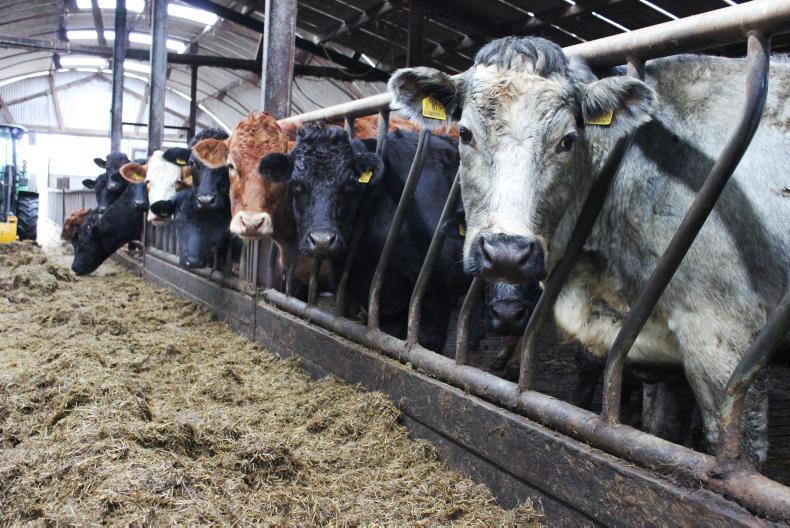
All farms participating in the BETTER Farm Beef Challenge NI programme have now completed their benchmarking review for 2017. This week, an overview of the farm’s financial and physical performance is detailed, with a more comprehensive analysis of the individual farms featured over the next two weeks.
Benchmarking data is completed through CAFRE and the farms use the calendar year to compare data as it ideally suits the systems in place on the farms.
Progress
During the previous phases of the programme, benchmarking analysis has been crucial to identifying areas for improvement on farm.
It was also used as a baseline for the programme farms, from which targets were set of what could possibly be achieved by following a specific farm plan.
Current benchmarking analysis is used as a barometer on the progress being made on farms and to highlight which areas still need to be addressed to meet projected targets.
Per hectare
When analysing financial performance, farms are compared on a per-hectare basis. Experience of farm planning would show that you need to look at the farm as a whole, rather than on the more common per-cow basis.
For the majority of farmers, land will be the most limiting and valuable resource within the business.
Therefore, the decisions to alter the farm system must maximise the profit per hectare of land farmed.
Comparisons can be made between different production systems to determine which one will offer the best profit margin per hectare of land farmed.
Gross margin
The financial results published are based on gross margin (GM) per farm, simply because fixed costs vary significantly on individual farms.
For instance, some farms are in an expansion mode and require investment in additional housing.
Other farms can be heavily mechanised or have a high reliance on rented land, which will increase fixed costs that are not necessarily reflective of normal suckler herd costs.
Gross margin across the programme farms varies by more than £800/ha between the top and bottom farms. Direct subsidies are excluded when calculating GM.
It is worth making the point that farms with a high GM/ha are not necessarily the most profitable farms and vice versa.
A farm with a high GM/ha can have a high level of fixed costs, or repayments on borrowed capital that can erode the higher GM.
Calculating GM/ha
Gross margin per hectare is calculated by subtracting variable costs from herd output/sales.
Herd output is calculated as the total sales of livestock (prime cattle and cull animals) minus any change in the value of cattle from the beginning to the end of the year, which should include any stock purchases.
Variable costs include all forage costs such as fertiliser and purchased fodder. Also included are purchased concentrate and additional feed, breeding (AI), veterinary and sundry costs directly associated with the herd (tags, haulage, scanning, etc).
To calculate GM/ha, simply deduct variable costs from total herd output and divide the number of hectares farmed.
Financial performance 2017 v 2016
Across the programme farms, GM/ha averaged £707 in 2017 compared with £574/ha in 2016, giving a 23% increase year on year.
Oliver McKenna has the highest GM/ha at £1,053 for 2017, an increase of £171/ha on the previous year.
He is followed by the partnership of Declan Rafferty and Aidan Quinn on £953/ha.
Both farms were involved in phase two of the programme and Table 2 outlines how GM/ha has moved over the past five years.
In 2013, GM/ha averaged £355 for both businesses, rising to £1,003 for 2017.
New farms
The seven remaining farms joined the new programme last March. While it is still early in terms of implementing the farm plans, there has been significant progress made in terms of breeding programmes, grazing programmes and removing poor-performing animals.
GM/ha for the new farms averaged £623 in 2017, compared with £520/ha in the previous year.
The example set by the two farms from phase two show how GM can be increased year on year by following a farm plan.
GM changes
Eight of the farms increased GM during 2017, with the exception of Mark Lewis who had a drop in GM.
However, this can be attributed to increased spending on breeding stock to increase cow numbers, as well as retaining more homebred heifers for breeding.
As these animals will calve down in 2018, they will produce cattle that can be sold in 2019, delivering a net increase in herd output and sales income.
The biggest increases in GM/ha were achieved by Paul and Thomas Jamison (+£379) followed by Declan Rafferty and Aidan Quinn (+£305), as well as Fionbharr Hamill (+£272).
Output
Herd output increased from £1,054/ha in 2016 to £1,283/ha. Cattle prices had a bearing on the increase in output with direct cattle sales increasing by £38 to £1,191/ha in 2017.
Increased stock numbers on farm, plus stock valuations and cattle weights, also led to an increase in herd output.
Variable costs
Variable costs averaged £576/ha in 2017, compared with £480 in 2016. Key increases came in the form of increased forage costs (+£24) coming from a change in fertiliser use, with more compound NPK products used as well as additional purchases of silage.
Concentrate feed increased by £41 to £225/ha. Feed costs increased due to higher ration prices in the latter stages of 2017, along with increased meal feeding to offset fodder issues last autumn.
Veterinary and breeding costs increased by over £30 to £104/ha. Most of the farmers increased their spending on preventative medicine with vaccination programmes now in place, as well as drugs used for synchronisation programmes to facilitate greater use of AI.


SHARING OPTIONS