With the latest €uro-Star evaluation taking place at the end of September, we take a look at the updated €uro-Star indexes from the 27 BETTER beef farms.
You can find your updated €uro-Star values on your ICBF.com HerdPlus account under ‘‘reports’’. Physical versions were also sent in the post recently.
Ranking the BETTER farmers overall and indeed within replacement index on important sub-traits, the first thing you notice is the gulf between top and bottom.
He runs Aberdeen Angus cows, many crossed out of the dairy herd. His milk index figure is 8.7kg – almost twice the national average. It is showing in his weaning performance too – his 594kg cows are producing 43% of their weight at 200 days in their calves.
With his prevailing Angus genetics pulling days from gestation length, Sweeney tops the fertility table too. Sweeney’s index figure for calving interval is -2.92 versus a group average of -1.20.
John McSweeney (left)
However, growth and weight for age are important traits in a cow too and Sweeney’s lack of a beef injection coming from his cow herd shows in his overall replacement index value of €86 or four stars.
Carcase weight is the index tool for predicting the genetic influence on growth and John McSweeney’s mature herd holds the lowest carcase weight figure of 3kg.
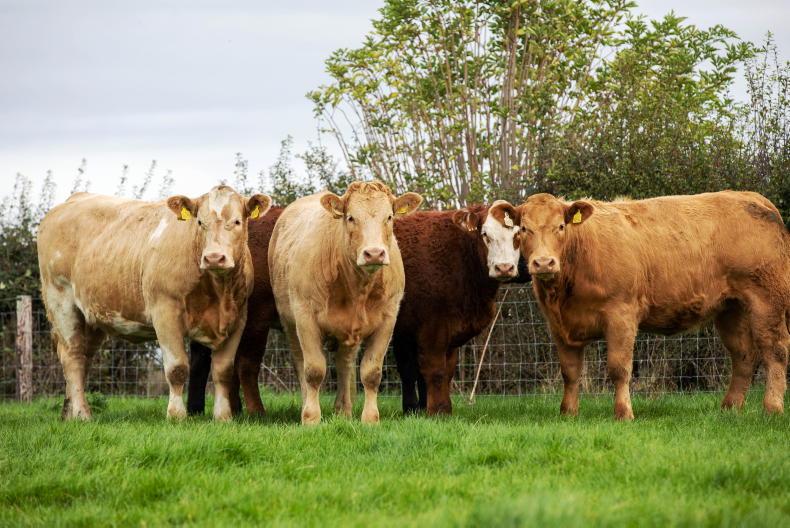
The group average is 12.4kg and Galway-man Nigel O’Kane tops the carcase weight table with 22kg. Nigel keeps continental cows and is a big AI user, with an attachment to maternal Charolais sires.
Nigel O’Kane
However, Nigel’s average cow weights 703kg and though he’s weaning a heavier calf than John, his cows are still producing just 39% of their weight at 200 days.
All of that extra weight needs feeding.
What do the index values mean?
We often get asked what the figures such as carcase weight figure or calving interval actually mean, the absolute numbers behind them that is.
The answer is to focus not on the numbers themselves but on the index differences between two animals.
Performance is a function of the animal’s genetics and their environment (feeding, management, health, etc). If environment is kept consistent, ie the animals are produced in the exact same circumstances, then the difference in these index values is the predicted difference in performance that genetics will account for.
This content is available to digital subscribers and loyalty code users only. Sign in to your account, use the code or subscribe to get unlimited access.
The reader loyalty code gives you full access to the site from when you enter it until the following Wednesday at 9pm. Find your unique code on the back page of Irish Country Living every week.
CODE ACCEPTED
You have full access to the site until next Wednesday at 9pm.
CODE NOT VALID
Please try again or contact support.
You can find your updated €uro-Star values on your ICBF.com HerdPlus account under ‘‘reports’’. Physical versions were also sent in the post recently.
Ranking the BETTER farmers overall and indeed within replacement index on important sub-traits, the first thing you notice is the gulf between top and bottom.
He runs Aberdeen Angus cows, many crossed out of the dairy herd. His milk index figure is 8.7kg – almost twice the national average. It is showing in his weaning performance too – his 594kg cows are producing 43% of their weight at 200 days in their calves.
With his prevailing Angus genetics pulling days from gestation length, Sweeney tops the fertility table too. Sweeney’s index figure for calving interval is -2.92 versus a group average of -1.20.
John McSweeney (left)
However, growth and weight for age are important traits in a cow too and Sweeney’s lack of a beef injection coming from his cow herd shows in his overall replacement index value of €86 or four stars.
Carcase weight is the index tool for predicting the genetic influence on growth and John McSweeney’s mature herd holds the lowest carcase weight figure of 3kg.
The group average is 12.4kg and Galway-man Nigel O’Kane tops the carcase weight table with 22kg. Nigel keeps continental cows and is a big AI user, with an attachment to maternal Charolais sires.
Nigel O’Kane
However, Nigel’s average cow weights 703kg and though he’s weaning a heavier calf than John, his cows are still producing just 39% of their weight at 200 days.
All of that extra weight needs feeding.
What do the index values mean?
We often get asked what the figures such as carcase weight figure or calving interval actually mean, the absolute numbers behind them that is.
The answer is to focus not on the numbers themselves but on the index differences between two animals.
Performance is a function of the animal’s genetics and their environment (feeding, management, health, etc). If environment is kept consistent, ie the animals are produced in the exact same circumstances, then the difference in these index values is the predicted difference in performance that genetics will account for.
If you would like to speak to a member of our team, please call us on 01-4199525.
Link sent to your email address
We have sent an email to your address. Please click on the link in this email to reset your password. If you can't find it in your inbox, please check your spam folder. If you can't find the email, please call us on 01-4199525.
ENTER YOUR LOYALTY CODE:
The reader loyalty code gives you full access to the site from when you enter it until the following Wednesday at 9pm. Find your unique code on the back page of Irish Country Living every week.


SHARING OPTIONS