The average soil carbon stock in the top 30cm of soil on the Footprint Farmers’ programme farms is 74.2t/ha.
However, the range in soil carbon levels is as low as 21.9t/ha and as high as 313.9t/ha. The samples have been taken to identify soil carbon stocks and prepare these farms for soil carbon trading if it comes to pass. These results also give a great indication of soil health.
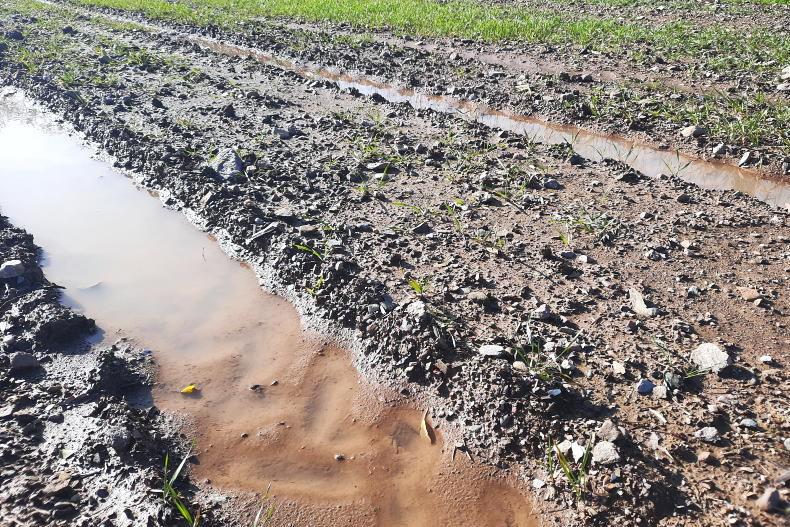
Almost 900ha of land will be sampled under the programme. The majority of samples returned so far are from grassland farms, as sampling proved difficult in a tillage situation and the remainder will be completed after harvest once crops are removed.
The results
There is a huge range in the results. The lowest result of 21.9t C/ha is from Tullamore Farm. While this figure is low and improving soil carbon levels would help to improve soil health, this low figure could have huge potential in a carbon trading situation as there is lots of room to increase soil carbon storage.
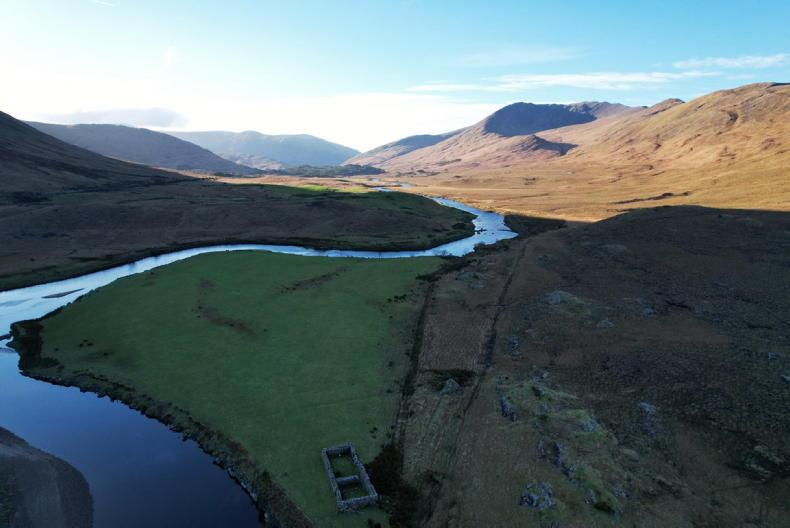
The sample with the highest level of carbon is from a heavy soil in the west of Ireland. It is good that the soil is high in carbon and storing that carbon.
However, this carbon is also at risk of loss and there is less potential to store more carbon, so there are pluses and minuses to high and low soil carbon levels.
How did we sample?
Took representative soil samples.Covered an area of 4ha or less.Sampled to a depth of 30cm.Samples were taken with a sampling machine as hand sampling proved difficult and laborious.All sample points were recorded on GPS and can be revisited.What did we test for and calculate?
Bulk density.Total carbon.Carbon(C):Nitrogen(N) ratio.Total inorganic carbon.Total organic carbon.Estimated organic matter.Organic carbon stock (t/ha).Organic stock of sampled area (t).Bulk density is an essential measurement as it gives you the volume of soil in the top 30cm on a per hectare basis, so you know how many tonnes of soil are in the top 30cm of 1ha. You can then use the percentage of carbon to calculate the carbon storage.
The C:N ratio will also help to work out the health of your soil and see if other things are being affected by soil carbon levels. For example, where C:N ratio is less than 25:1, then soil nitrogen mineralisation will be slowed down.
Soil carbon percentage gives an indication of soil health as well. Soil carbon relates directly to soil organic matter. If you multiply the soil carbon percentage by 1.72, then you get the soil organic matter percentage, which we are very familiar with from soil samples. High soil organic matter levels mean that there are more nutrients available from the soil. It also helps with soil structure and water infiltration.
Sampling time
It is important to remember that soil carbon can be sampled at any time of the year, as it builds slowly over time. It is not like sampling for phosphorus or potassium for example, where you should not sample after the application of slurry or fertiliser.
How much does it cost?
The samples in the lab cost €32 plus VAT. This was for the package, which is becoming quite standard in labs across the country and abroad as more interest grows in storing carbon in the soil. The actual soil sampling cost was €40/sample. We did take some samples by hand to 30cm on Tullamore Farm previously, but were not happy with the sample as it was inconsistent. Full cores were not coming up with the soil sampler each time and it also took quite a lot of time.
Sampling time
It is important to remember that soil carbon can be sampled at any time of the year, as it builds slowly over time. It is not like sampling for phosphorus or potassium for example, where you should not sample after the application of slurry or fertiliser.
Increasing/decreasing carbon stocks
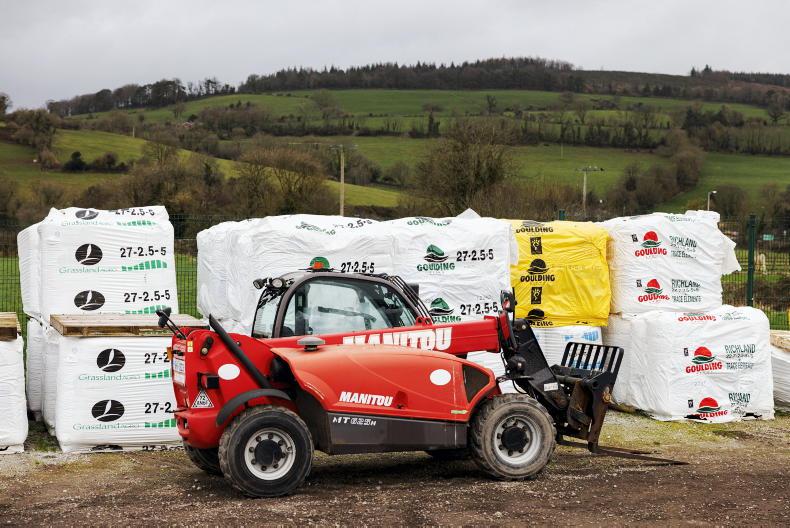
Farmers can build up soil carbon levels by applying farmyard manure or slurry to land, by grazing animals on land, adding biodiversity to the soil by increasing plant diversity, incorporating straw, growing and incorporating cover crops into soil. However, things like drainage, tilling for crops or grass reseeding and land drying out can cause carbon loss.
More to come: In the coming weeks, we will provide more detailed information on the soil carbon results, including why they might be high or low, or problems encountered when soil sampling (it needs to be done twice).
We took these soil carbon samples as part of the Footprint Farmers Programme to gain valuable information for the industry in terms of soil carbon levels. With all the talk on soil carbon, it is essential to have information. These samples are giving a baseline for soil carbon levels on 900ha.
This will be there if we find a way to trade carbon credits from soil carbon levels being built up in soil, if it does build up. This is only the first set of soil samples, a second set will need to be taken to see if soil carbon storage increases. If it does this means that some on-farm emissions are being offset by storing carbon in the soil.
If we did not have funding for these samples, it would not be practical to take them on a regular farm, as it is so expensive. It is also important to note that the cost of sampling is also higher than the current price available for 1t of carbon on the European Emissions Trading System, approximately €85/t.
The average soil carbon stock in the top 30cm of soil on the Footprint Farmers’ programme farms is 74.2t/ha.
However, the range in soil carbon levels is as low as 21.9t/ha and as high as 313.9t/ha. The samples have been taken to identify soil carbon stocks and prepare these farms for soil carbon trading if it comes to pass. These results also give a great indication of soil health.
Almost 900ha of land will be sampled under the programme. The majority of samples returned so far are from grassland farms, as sampling proved difficult in a tillage situation and the remainder will be completed after harvest once crops are removed.
The results
There is a huge range in the results. The lowest result of 21.9t C/ha is from Tullamore Farm. While this figure is low and improving soil carbon levels would help to improve soil health, this low figure could have huge potential in a carbon trading situation as there is lots of room to increase soil carbon storage.
The sample with the highest level of carbon is from a heavy soil in the west of Ireland. It is good that the soil is high in carbon and storing that carbon.
However, this carbon is also at risk of loss and there is less potential to store more carbon, so there are pluses and minuses to high and low soil carbon levels.
How did we sample?
Took representative soil samples.Covered an area of 4ha or less.Sampled to a depth of 30cm.Samples were taken with a sampling machine as hand sampling proved difficult and laborious.All sample points were recorded on GPS and can be revisited.What did we test for and calculate?
Bulk density.Total carbon.Carbon(C):Nitrogen(N) ratio.Total inorganic carbon.Total organic carbon.Estimated organic matter.Organic carbon stock (t/ha).Organic stock of sampled area (t).Bulk density is an essential measurement as it gives you the volume of soil in the top 30cm on a per hectare basis, so you know how many tonnes of soil are in the top 30cm of 1ha. You can then use the percentage of carbon to calculate the carbon storage.
The C:N ratio will also help to work out the health of your soil and see if other things are being affected by soil carbon levels. For example, where C:N ratio is less than 25:1, then soil nitrogen mineralisation will be slowed down.
Soil carbon percentage gives an indication of soil health as well. Soil carbon relates directly to soil organic matter. If you multiply the soil carbon percentage by 1.72, then you get the soil organic matter percentage, which we are very familiar with from soil samples. High soil organic matter levels mean that there are more nutrients available from the soil. It also helps with soil structure and water infiltration.
Sampling time
It is important to remember that soil carbon can be sampled at any time of the year, as it builds slowly over time. It is not like sampling for phosphorus or potassium for example, where you should not sample after the application of slurry or fertiliser.
How much does it cost?
The samples in the lab cost €32 plus VAT. This was for the package, which is becoming quite standard in labs across the country and abroad as more interest grows in storing carbon in the soil. The actual soil sampling cost was €40/sample. We did take some samples by hand to 30cm on Tullamore Farm previously, but were not happy with the sample as it was inconsistent. Full cores were not coming up with the soil sampler each time and it also took quite a lot of time.
Sampling time
It is important to remember that soil carbon can be sampled at any time of the year, as it builds slowly over time. It is not like sampling for phosphorus or potassium for example, where you should not sample after the application of slurry or fertiliser.
Increasing/decreasing carbon stocks
Farmers can build up soil carbon levels by applying farmyard manure or slurry to land, by grazing animals on land, adding biodiversity to the soil by increasing plant diversity, incorporating straw, growing and incorporating cover crops into soil. However, things like drainage, tilling for crops or grass reseeding and land drying out can cause carbon loss.
More to come: In the coming weeks, we will provide more detailed information on the soil carbon results, including why they might be high or low, or problems encountered when soil sampling (it needs to be done twice).
We took these soil carbon samples as part of the Footprint Farmers Programme to gain valuable information for the industry in terms of soil carbon levels. With all the talk on soil carbon, it is essential to have information. These samples are giving a baseline for soil carbon levels on 900ha.
This will be there if we find a way to trade carbon credits from soil carbon levels being built up in soil, if it does build up. This is only the first set of soil samples, a second set will need to be taken to see if soil carbon storage increases. If it does this means that some on-farm emissions are being offset by storing carbon in the soil.
If we did not have funding for these samples, it would not be practical to take them on a regular farm, as it is so expensive. It is also important to note that the cost of sampling is also higher than the current price available for 1t of carbon on the European Emissions Trading System, approximately €85/t.


SHARING OPTIONS