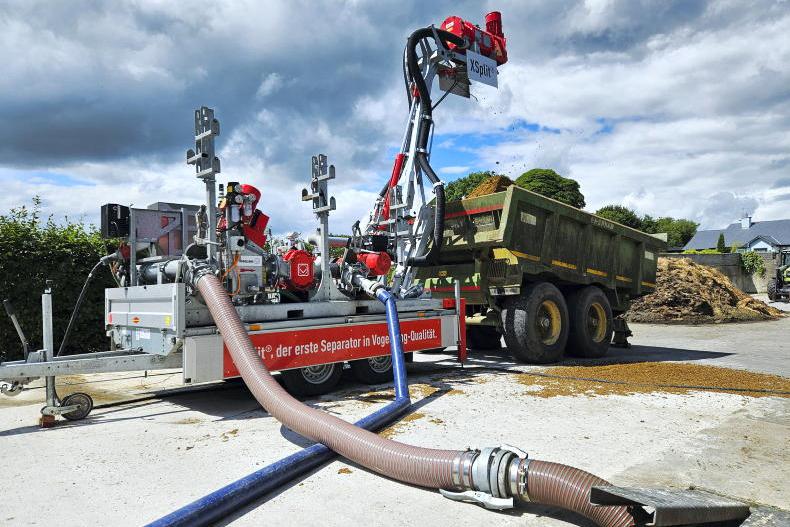
Slurry samples taken from Tullamore Farm were below guide rates often used on farms and prove the value of carrying out a test.
Phosphorus (P) and potassium (K) levels were most disappointing, with one sample not even supplying one unit of P per 1,000 gallons, while the K levels of slurry from animals receiving a mainly grass diet were well below par. The samples likely reflect the ground where the silage is being produced, which is depleted in P and K at indices of 1 and 2 in many cases.
However, had the slurry not been tested, we would not know what had gone out onto the ground and would have been going on guide values. For instance, the Teagasc guide value for slurry with a dry matter content of 6% is 9-5-32 per 1,000 gallons.
Tullamore Farm’s samples were well off this mark. Looking at Table 1, the top nitrogen (N) value was 6.46 units/1,000 gallons, the top P value was 1.58 units/1,000 gallons and the top K value was 13.22 units/1,000 gallons.
On the other end of the scale, N went down to 5.55 units/1,000 gallons, P fell to 0.72 units/1,000 gallons and K dropped to as low as 3.67 units/1,000 gallons.
At these levels, the slurry applied on the farm at rates of 2,600 gallons/ac is way off the rates required to produce grass for grazing or silage. So far, this slurry has been applied to grazing ground.
The results are displayed in Table 1. Sample 1 is from under the bulls, which had not been fed a lot of meal up to the time of sampling and may help to describe the low P level. Samples 2 and 3 are from under the heifers and dry cows.
Putting a monetary value on this slurry, it is much less than expected as shown in Table 2. The Teagasc guide of 9-5-32 works out at about €45.48/1,000 gallons. However, the slurry on Tullamore Farm has a much lower value than this at €12.58/1,000 gallons, €15.10/1,000 gallons and €20.09/1,000 gallons.
In order to give a silage crop the best chance, it is important to feed it enough P and K. P and K indices are a problem on the farm and need to be built, but at present, feeding the crop is the priority and this slurry is not carrying out that job, so it will need to be topped up.
Slurry is yet to be applied to silage ground on the farm and as bulls are being fed meal ad-lib at present, the level of P in that slurry is likely to rise somewhat. It should be noted that a large proportion of soils are at index 3 and 4 on Tullamore Farm, but the silage ground is among the lower soil indices. Grazing ground is in a better position for P and K.
The focus at present is on silage. With fertiliser prices at record highs, building soil indices with artificial fertiliser is an expensive option. Tullamore Farm is in a derogation and is at its limit on slurry, so importing things like pig slurry isn’t an option.
The small amount of farmyard manure should be targeted to the low index P and K soils. Soil pH is at high levels, so the addition of lime will not help on this front. A lower soil pH may help to make nutrients more available.
To feed the crop without trying to build soil indices, farmers should look at the P and K requirements at index 3, as this does not include additional fertiliser to build indices, as can be seen in Table 3.
Table 4 shows samples 1, 2 and 3 and the balance of fertiliser needed when this slurry is applied at a rate of 2,600 gallons/ac.
Taking sample 3 as an example, two bags of 0-7-30 per acre would supply some P to build indices and a large majority of the K requirement. As seen in Table 5, 1.85 bags/ac of protected urea (46% N) would then supply the remainder of the N requirement.
At a price of €740/t for 0-7-30 and €1,000/t for protected urea, this equates to an artificial fertiliser spend of approximately €166.50/ac.


SHARING OPTIONS