

Having recently received the soil test results for their individual farms, our group of eight Footprint Farmers had the opportunity to sit down with the Irish Farmers Journal technical team to discuss the management implications of their results.
Here, we present some of the key discussion points from this meeting, shedding light on common questions asked in relation to soil test results on beef, tillage and dairy farms.
Farm facts
Andrew’s soil test results were positive overall, but revealed that some fields had surprisingly low scores (index 1 or index 2) for K.
Andrew explained that there are some areas of peatier soil on the farm, where it is naturally more difficult to increase K.
He also explained that the lower scoring fields are generally silage fields, which have a very high K demand in comparison to grazing land.
Andrew is hoping to plant red clover silage swards on some of the silage ground that is low in K in the future. He agreed with the advice given that it’s best to get the soil nutrient balance right before planting, as red clover requires high P and K.
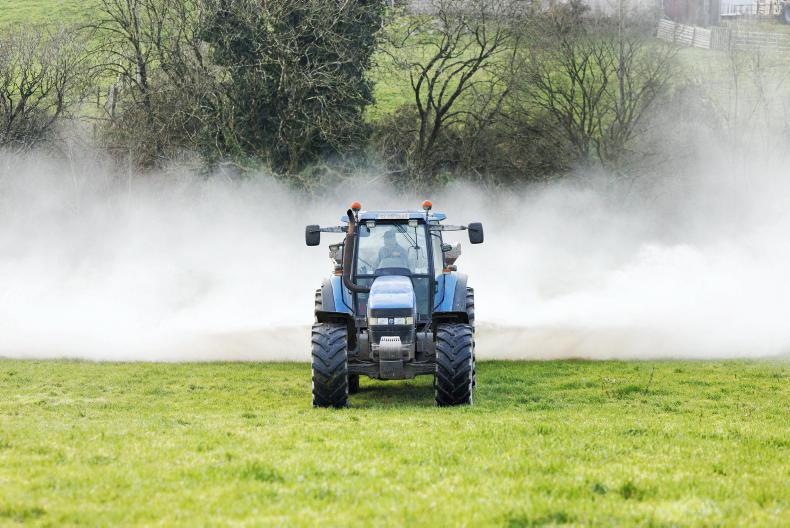
As high K can lock up magnesium and lead to issues with grass tetany, it was suggested that Andrew opt for autumn rather than spring spreading when attempting to frontload K.
The group also discussed the growing range of options for importing organic fertilisers, including digestate and slurries.
It was cautioned that the nutrient values of both can vary widely and that it is therefore a good idea to carry out a laboratory test of the constituents before importing organic fertilisers on to the farm.
When combined with soil test results, laboratory testing of organic inputs also allows for greater efficiency through more targeted spreading. For example, slurry high in K could be applied to a field which is low in K.
While committed to getting soil nutrient balances to ‘optimum’ levels across most of his farm, Andrew was less concerned about soil fertility levels on areas where his objective was to protect and enhance biodiversity, such as the species-rich grassland that was managed as traditional hay meadows under GLAS, as well as geese and swan and wild bird cover areas under ACRES.
In fact, lower soil nutrient levels, as well as a variety of pH levels, are crucial for many of our native plants and the wildlife that relies on them.
Farm facts
While soil test results across most of Barry’s farm were good, he was surprised that Ps and Ks had dropped in some of the grazing fields on his milking platform since last year.
In terms of K, like Andrew, Barry felt that there were some areas of peatier soil that may help to explain his struggle to maintain K in certain areas.
There was also discussion among the group around whether trace element imbalances, such as high calcium, may be responsible for locking up K in the soil.
Footprint Farmer Gareth Culligan suggested that while traditional soil test results don’t offer enough evidence to allow farmers to confidently address mineral imbalances beyond the basics, Albrecht soil sampling does.
The eight Footprint Farms have been sampled for Albrecht testing and we will be reporting in more detail on this method in the coming weeks. Barry is keen to see the results of the Albrecht testing and to take it from there.
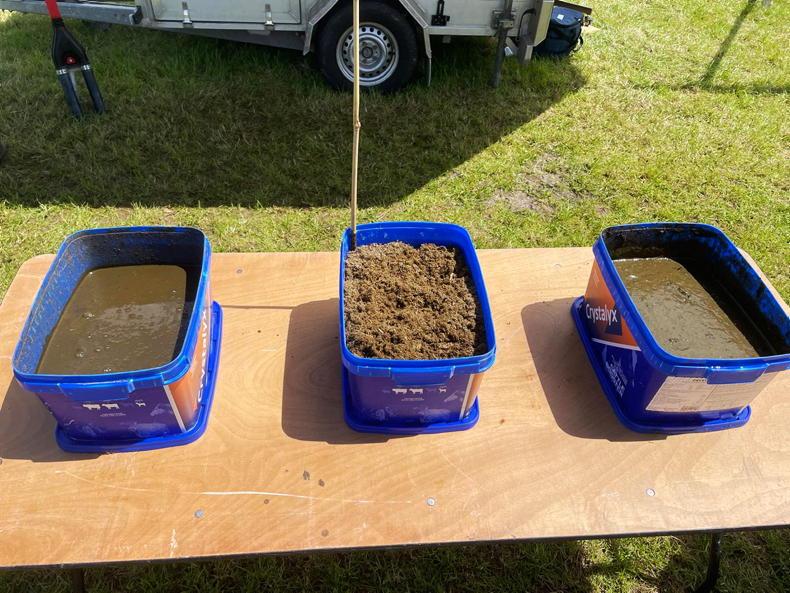
The group discussed the fact that soil sampling is not 100% accurate
Barry also questioned results which showed a drop in P from index 4 to index 1 on some fields since last year, despite no major changes in management.
One possible explanation discussed by the group was that the soil simply wasn’t getting enough P from the parlour washings that were applied: there are only 0.7 units of P in 1,000 gallons of soiled water, in comparison to five units of P in 1,000 gallons of thick cattle slurry.
Barry also didn’t have much room to manoeuvre in terms of P allowances last year, as his Ps were high overall, but his few fields with low P values this year should result in a higher P allowance, allowing him to adjust accordingly.
Finally, the group discussed the fact that soil sampling is not 100% accurate, and that there are a number of other factors that can explain variation in soil test results from year to year (see top tips below).


SHARING OPTIONS