Farmers who sent away soil samples over the winter are receiving the results around now. Most of the labs give a detailed breakdown of the pH, phosphorus and potash levels in a table format. Some use colour-coded bar charts to show where each sample ranks in terms of the nutrients available relative to target.
Increasingly, I see farmers and advisers using maps to plot the nutrient status of the farm. Unlike a table, a map gives a much better picture of where the nutrient surpluses and deficiencies are. By right, you should have four colours on the map representing each soil index and you will need one map for each nutrient.
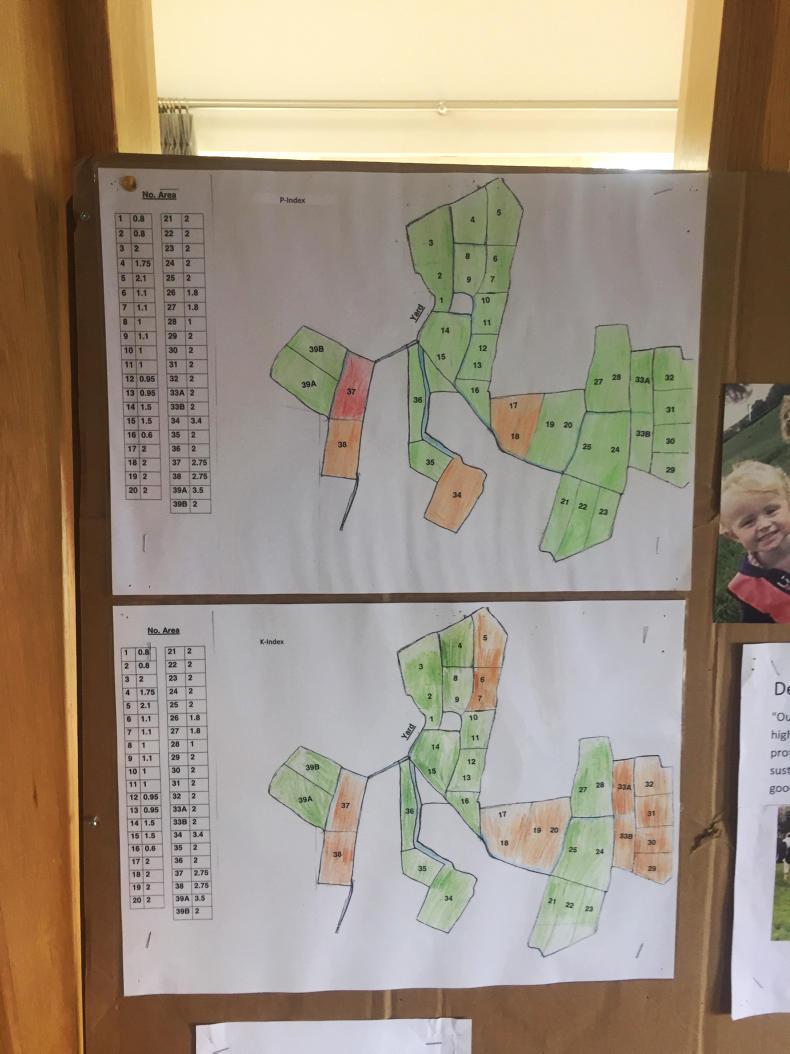
This map belonging to Eddie O'Donnell, winner of the 2017 Grassland Farmer of the Year award shows the parts of the farm that are deficient in phosphorus and potassium.
This map belonging to Eddie O'Donnell, winner of the 2017 Grassland Farmer of the Year award shows the parts of the farm that are deficient in phosphorus and potassium.
Fields on the map with a soil index three and four should be shaded light and dark green, respectively. Fields with a soil index of one and two should be red and amber, signifying a deficiency.
Most farmers will use intervals in the pH scale to segment fields into those on or below target. A pH of 6.3 is the target for most grassland farms, so anything above a pH of 6 is generally considered to be on target. Teagasc advisers can colour-code and print out the maps used for the nutrient management plans. Other farmers use their own farm maps and shade in colours using crayons or markers. The purpose is to give a visual of the parts of the farm that need attention for one or more nutrients.
These maps should be put up on the wall in the farm office, in the dairy, or kept on the tractor spreading fertiliser so the operator knows that when he or she is spreading compound fertiliser or slurry that these paddocks either need a higher rate or, in the case of soil index four, paddocks can be skipped.
Fertiliser programme
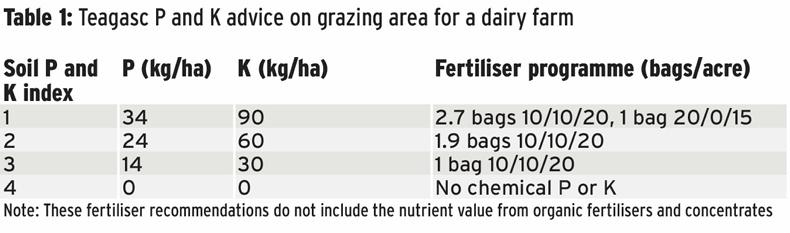
Table 1 gives an example of a fertiliser programme for phosphorus and potassium for the grazing area of a dairy farm. The fertiliser advice doesn’t include the value of slurry or farmyard manure, so the value of these should be deducted from the chemical fertiliser component. Of course, how much chemical fertiliser to spread will be determined by the stocking rate and the nutrient management plan.
The key thing from the table is that you need to know the P and K status of the farm before you can decide on a plan, therefore you need to be soil sampling. At soil index one and two, the suggested application rates in the table will help to maintain and build up soil fertility. Only a maintenance application rate is required for soils at index three, while no additional P or K is required for soils at index four.
Of course, before going for the compounds, the first thing to look at is the lime or pH status. It’s pointless to spend a lot of money trying to improve phosphorus levels if the pH is wrong. The chemical fertiliser won’t be lost, but it won’t be used either.
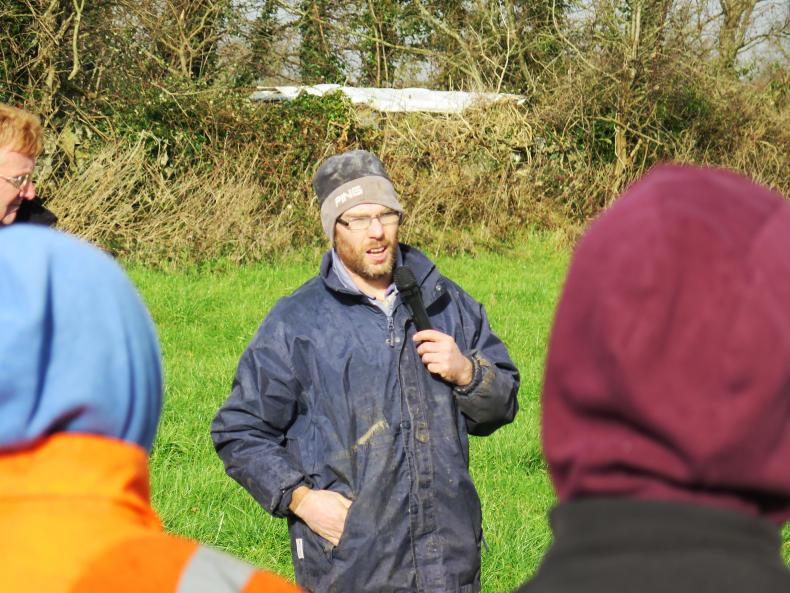
Limerick dairy farmer Philip Ruttle is doing his best to improve soil fertility on his farm at Rathkeale. Speaking at a Grass10 farm walk recently, he said he plans to start spreading compound fertiliser in March.
“I’ll probably go with two bags/acre of 18:6:12 on the low P and K fields if the weather is good. I won’t spread it if the weather is unsettled as there is a risk of the nitrogen leaching. If the weather isn’t settled, I’ll spread urea in March and go with compounds in the next round,” Philip said.
Philip already has 80% of the farm spread with 26 units/acre of urea and has 20% of the farm spread with 3,500 gallons/acre of slurry.
Last year, Philip spread 40.5kg/ha P and 230kg/ha of K including what was in slurry. He grew 12.78t/ha of grass and produced 33,645kg of milk solids from the 38ha milking block.
Forty per cent of the farm is on target for P, but only 20% is on target for K. While the P level is low, the farm is improving. Nearly all of the farm was at index one and two for K in 2017, but it has improved at the most recent soil sampling. Eighty per cent still remains low, however.
Philip spread one bag/acre of muriate of potash at the back end of 2017 and will probably do the same this back end. On P, he is planning to go with the little-and often-approach, targeting slurry and compounds such as 0:7:30, 18:6:12, 26:0:0:14 and rich land along with straight potash on the low-index fields. These will be spread from March to August.
Read more
Spring grazing jumps up a gear
Dairy management: good weather, mastitis, and keeping bull calves
Farmers who sent away soil samples over the winter are receiving the results around now. Most of the labs give a detailed breakdown of the pH, phosphorus and potash levels in a table format. Some use colour-coded bar charts to show where each sample ranks in terms of the nutrients available relative to target.
Increasingly, I see farmers and advisers using maps to plot the nutrient status of the farm. Unlike a table, a map gives a much better picture of where the nutrient surpluses and deficiencies are. By right, you should have four colours on the map representing each soil index and you will need one map for each nutrient.
This map belonging to Eddie O'Donnell, winner of the 2017 Grassland Farmer of the Year award shows the parts of the farm that are deficient in phosphorus and potassium.This map belonging to Eddie O'Donnell, winner of the 2017 Grassland Farmer of the Year award shows the parts of the farm that are deficient in phosphorus and potassium.
Fields on the map with a soil index three and four should be shaded light and dark green, respectively. Fields with a soil index of one and two should be red and amber, signifying a deficiency.
Most farmers will use intervals in the pH scale to segment fields into those on or below target. A pH of 6.3 is the target for most grassland farms, so anything above a pH of 6 is generally considered to be on target. Teagasc advisers can colour-code and print out the maps used for the nutrient management plans. Other farmers use their own farm maps and shade in colours using crayons or markers. The purpose is to give a visual of the parts of the farm that need attention for one or more nutrients.
These maps should be put up on the wall in the farm office, in the dairy, or kept on the tractor spreading fertiliser so the operator knows that when he or she is spreading compound fertiliser or slurry that these paddocks either need a higher rate or, in the case of soil index four, paddocks can be skipped.
Fertiliser programme
Table 1 gives an example of a fertiliser programme for phosphorus and potassium for the grazing area of a dairy farm. The fertiliser advice doesn’t include the value of slurry or farmyard manure, so the value of these should be deducted from the chemical fertiliser component. Of course, how much chemical fertiliser to spread will be determined by the stocking rate and the nutrient management plan.
The key thing from the table is that you need to know the P and K status of the farm before you can decide on a plan, therefore you need to be soil sampling. At soil index one and two, the suggested application rates in the table will help to maintain and build up soil fertility. Only a maintenance application rate is required for soils at index three, while no additional P or K is required for soils at index four.
Of course, before going for the compounds, the first thing to look at is the lime or pH status. It’s pointless to spend a lot of money trying to improve phosphorus levels if the pH is wrong. The chemical fertiliser won’t be lost, but it won’t be used either.
Limerick dairy farmer Philip Ruttle is doing his best to improve soil fertility on his farm at Rathkeale. Speaking at a Grass10 farm walk recently, he said he plans to start spreading compound fertiliser in March.
“I’ll probably go with two bags/acre of 18:6:12 on the low P and K fields if the weather is good. I won’t spread it if the weather is unsettled as there is a risk of the nitrogen leaching. If the weather isn’t settled, I’ll spread urea in March and go with compounds in the next round,” Philip said.
Philip already has 80% of the farm spread with 26 units/acre of urea and has 20% of the farm spread with 3,500 gallons/acre of slurry.
Last year, Philip spread 40.5kg/ha P and 230kg/ha of K including what was in slurry. He grew 12.78t/ha of grass and produced 33,645kg of milk solids from the 38ha milking block.
Forty per cent of the farm is on target for P, but only 20% is on target for K. While the P level is low, the farm is improving. Nearly all of the farm was at index one and two for K in 2017, but it has improved at the most recent soil sampling. Eighty per cent still remains low, however.
Philip spread one bag/acre of muriate of potash at the back end of 2017 and will probably do the same this back end. On P, he is planning to go with the little-and often-approach, targeting slurry and compounds such as 0:7:30, 18:6:12, 26:0:0:14 and rich land along with straight potash on the low-index fields. These will be spread from March to August.
Read more
Spring grazing jumps up a gear
Dairy management: good weather, mastitis, and keeping bull calves


 This is a subscriber-only article


SHARING OPTIONS: