

They’re the results that the tillage industry has been waiting for – the carbon footprint of Irish grain.
For a long time now, the Irish tillage industry has been asking for figures on how Irish produce compares from an environmental point of view with grain produced around the world.
John Spink, head of crops, environment and land use at Teagasc, delivered results of a Tillage Lifecycle Analysis project at last week’s Teagasc National Tillage Conference held on Wednesday 31 January.
To be clear, these results are based on the long-running systems trial in Teagasc, which has tested different rotations and establishment systems in the same field for decades. Data from 2016 to 2020 was used for the purpose of this project.
It is the first part of this project that should shortly have results on figures for typical Irish farms.
Teagasc and Tirlán have been working together to collect and analyse data from a group of farmers.
The results can seem complicated, but the main thing to remember is: the lower the carbon footprint figure, the better.
Method used
John explained that there are two systems of carbon accounting.
One follows the Intergovernmental Panel on Climate Change, used for national inventories, and the other follows the Life Cycle Assessment method, which is used to calculate the carbon emissions of products.
Carbon emissions are reported in kg of carbon dioxide equivalents (kg CO2e), which is the number placed on the greenhouse gas (GHG) emissions produced. Carbon dioxide, nitrous oxide and methane emissions are all included in this figure.
Nitrous oxide is one of the main emissions on Irish tillage farms, and John placed emissions figures on different fertiliser products.
CAN and NPK products had the highest emissions factor, followed by urea and then protected urea. CAN mainly emits nitrous oxide. Urea is mostly subject to ammonia loss, which is not a GHG, but is still bad for air quality.
Crop residues and organic manures had a higher emissions factor, but do not necessarily release as much as the other products, due to the percentage of organic nitrogen in these natural products.
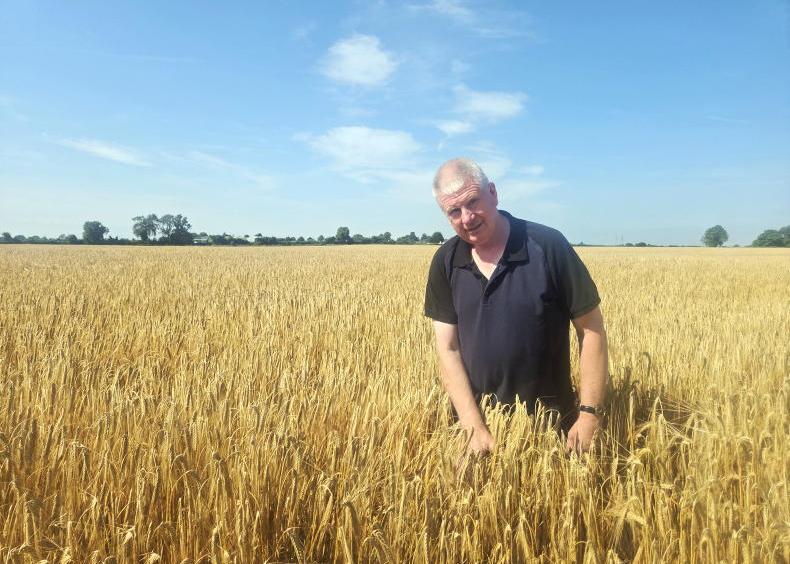
Winter wheat the lowest
Winter wheat in rotation and in a plough-based system had the lowest carbon footprint of the crops examined at 169.2kg CO2e/t, and was followed by winter wheat in a minimum-tillage system at 172.6kg CO2e/t (see Figure 1).
Winter oats in rotation was next. Oats in a plough-based system had a carbon footprint of 176.3kg CO2e/t, while oats in a minimum-tillage system had a carbon footprint of 180.9 kg CO2e/t.
Winter barley in rotation was not much higher than oats. Winter barley in a minimum-tillage system had a carbon footprint of 181.8kg CO2e/t, and in a plough-based system had a carbon footprint of 184.3kg CO2e/t.
Continuous wheat had the highest carbon footprint; there was very little difference between establishment systems.
Continuous wheat in a minimum-tillage system had a carbon footprint of 205.7kg CO2e/t, and continuous winter wheat in a plough-based system had a carbon footprint of 207.5kg CO2e/t.
This higher carbon footprint is most likely due to a slightly higher artificial nitrogen rate on continuous wheat, John explained.
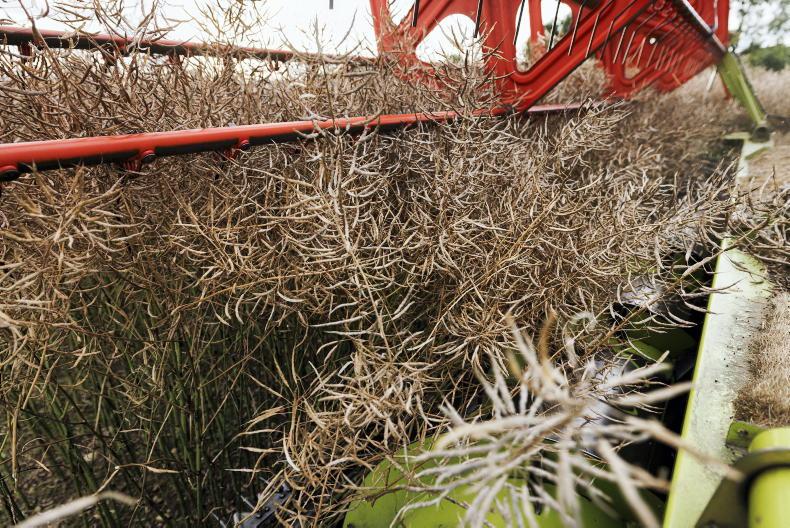
Winter oilseed rape in rotation had the highest carbon footprint of the crops examined. In a minimum-tillage system, the crop had a carbon footprint of 347.1kg CO2e/t and in a plough-based system, it had a carbon footprint of 350.1kg CO2e/t.
Yield has a big impact
John said that crop yield has a big impact on these figures. The carbon footprint is based on the carbon emissions per tonne of product produced.
Winter wheat is a high-input crop, but it has a high yield, so it is able to divide its carbon footprint over a greater yield.
Oilseed rape has a lower yield and this is most likely why the carbon footprint is high. However, oilseed rape has a higher energy density, because of the oil content – so if it was worked out on an energy basis, the carbon footprint might be lower.
However, it should be noted that oilseed rape management has changed dramatically over the past three years or so. Nitrogen rates have been cut massively as more farmers now calculate the green area of the crop and lower their nitrogen rate where they have a high score.
This practice would not have been common in the years used for this project from 2016 to 2020.
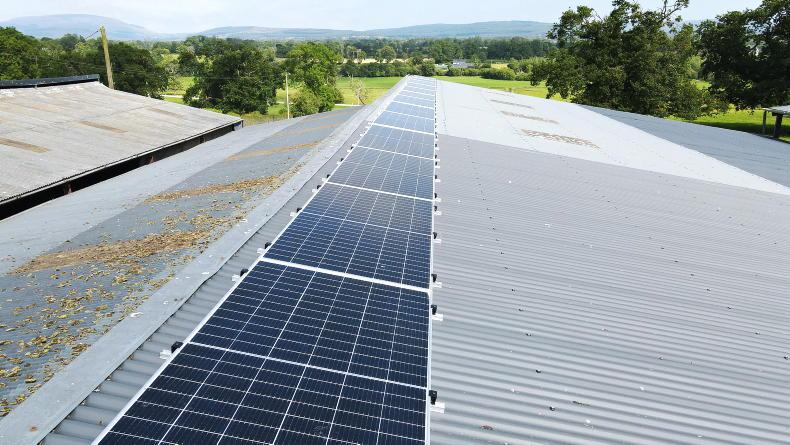
Plough and minimum tillage
There is very little difference in emissions between plough-based and minimum-tillage establishment systems.
Many may expect the plough-based system to have a higher carbon footprint, as it can release more carbon from the soil as a result of deeper tillage.
John explained that in minimum-tillage systems, you burn less diesel. However, crop yield is slightly lower and nitrous oxide emissions are usually higher in minimum-tillage systems.
Nitrous oxide is a lot more potent than carbon. As a result, the two systems almost balance out.
What contributes to the carbon footprint?
Figure 2 shows the breakdown of what contributes to the carbon footprint of winter wheat, and fertiliser manufacture takes up the biggest chunk, at almost half (48%).
The footprint of manufacture is accounted for where it is used. It is the same for crop protection products, but these only make up 1% of the total.
Fertiliser application was the next biggest contributor to carbon footprint at 24%, followed by fuel production and use at 14%, crop residues at 10%, seed at 3% and crop protection at 1%.
How much carbon is stored by straw?
Figure 3 shows us that there is a massive difference in the amount of carbon that is stored from straw incorporation on different soil types. Clay soils hold the most at 2,130kg CO2e/ha, followed by loam soils at 1,433kg CO2e/ha and sandy soils at 891kg CO2e/ha.
Winter oat straw was the best when it came to storing or sequestering carbon, at 183.4kg CO2e/t, followed by winter barley (154kg CO2e/t), winter wheat (133kg CO2e/t) and winter oilseed rape (76.1kg CO2e/t).
What’s the balance?
When using the figures for the carbon footprint of grain, you can only count emissions. However, we know that these emissions can be cancelled out by taking other steps like incorporating straw, planting cover crops, trees and allowing hedgerows to grow up and outwards.
If we take the amount of carbon sequestered from the straw from the carbon emitted by the crops, then we can see what the balance is (see Figure 5).
Once straw is chopped on a winter oat crop, for example, only 9.2kg CO2e/t remains unaccounted for.
Winter barley (44.6kg CO2e/t) and winter wheat (64.1kg CO2e/t) follow, while oilseed rape (294.4kg CO2e/t) is still the highest figure for emissions.
What are the carbon emissions of other products?
These maize and soybean carbon figures are from the Global Feed Lifecycle Assessment Institute’s database.
This research is very welcome. While there have been individual projects and industries calculating their own carbon figures, these are the first we’ve had from Teagasc.
It is only the start of this journey and is based on just one research trial at present, but now that this has been done, it should be possible to increase numbers and start to analyse individual crops and farms relatively quickly.
A group of Tirlán farmers will be the first group of real farms Teagasc will work with. That data has been gathered and is being analysed at present.
John commented that where farmers have systems like Gatekeeper, it should be easier to gather that data, as farmers will have their figures at hand easily. Nutrient management plans will play a big role in gathering data quickly as well.
The 10 Signpost farms should also provide good datasets to work with. The Signpost project focuses on the overall farm’s carbon footprint and can show if a tillage farm can be carbon neutral or not, but the carbon emissions of individual grains are needed.
Hopefully, this will also allow accurate Irish figures to be inputted into the Global Feed Lifecycle Assessment Institute’s database.
At present, Irish figures are based on UK figures, but with a slightly bigger yield making the carbon footprint slightly lower than the UK’s. Accurate figures are essential.
In turn, this will allow Bord Bia, Teagasc and the ICBF to improve their AgNav calculator, which calculates the carbon footprint of Irish meat and milk, but does not take an accurate account of the footprint of grain used in animal feed production.
SHARING OPTIONS